Who’d like a 0.05% dose of cyanide? It’s colourless and odorless, so…
1 Like
Still waiting for you to provide evidence that reducing fossil fuel emissions won’t impact CC. Put up or shut up.
Don’t think that one’s in the “maintain the status quo at absolutely all costs” agenda playbook.
Just say something about Al Gore and dodge, block, spin, repeat.
Simple question.
Simple answer, without the industrial revolution, (when I assume is what you are asking) going off 800,000 years worth of dating. Around 300ppm
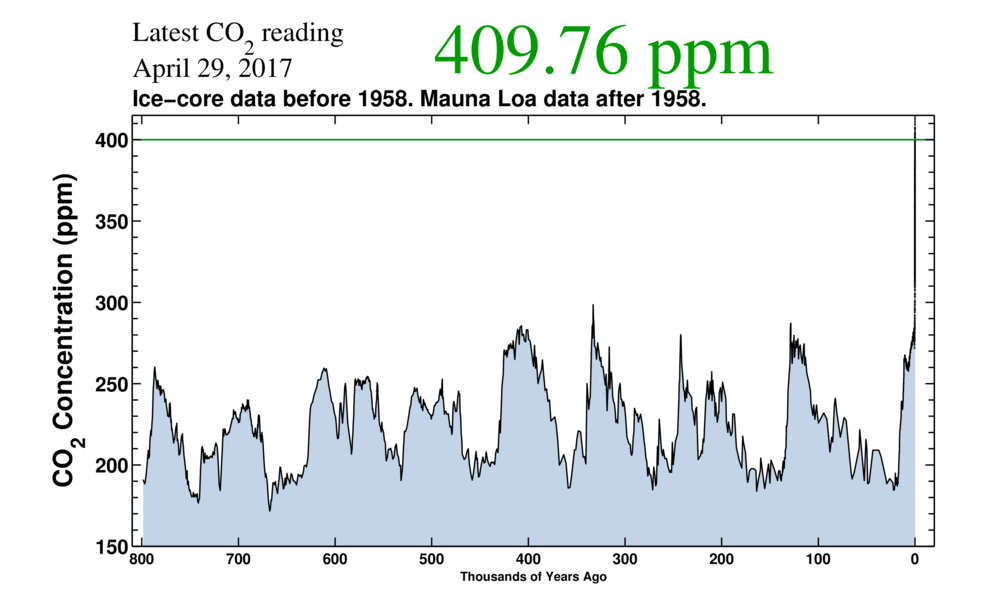
Gee I wonder wtf caused that spike at the end?
1 Like
Kinda but kinda not.
Australia does not set climate policy in a vacuum. Our stance influences others. Understandably, they don’t want to impost emissions control costs on their industries if we’re going to give our industries a free pass and allow our dirty industries to compete with their clean ones on an uneven playing field. Similarly, the less clean power research etc we do here, and the less of a market there is for clean generation capacity here (in our very wealthy, on a global scale, country), the slower clean tech develops and the slower it becomes cheaper due to economies of scale. Rich countries NEED to be early adopters on this stuff so that poorer countries can afford to make the changeover later on.
The Kyoto agreement, for instance, was severely weakened because the Howard govt threatened to walk away unless all sorts of exceptions were carved out and measures were weakened re coal, landclearing, etc etc. We had a negative effect hugely disproportionate to our size back then.
3 Likes
Probably the same thing that caused the spikes all the way through. You do see them don’t you? It’s amusing that you use that chart as evidence.
Perhaps your amusement stopped you from noticing that the final spike jumps to 409ppm where the others are below 300ppm? [quote=“werewolf, post:1747, topic:170, full:true”]
Probably the same thing that caused the spikes all the way through. You do see them don’t you? It’s amusing that you use that chart as evidence.
[/quote]
3 Likes
I had to look at that chart again. That peak up the top is really off the charts compared to what it has been in the past!
Needs a circle up there or something.
It’s not happening.
It’s not us.
It’s not so bad.
Now this is exactly the sort of skunkshit selective psuedoscience that profoundly ■■■■■■ me off.
Cherrypicking one chart, or one fact, that superficially suits your argument, and deliberately ignoring every single bit of context, and the entire body of human knowledge that surrounds that fact, and supports it, and gives it meaning…
Let me tell you a little ■■■■■■■ bit about atmospheric CO2 and climate in the ■■■■■■■ era of the ■■■■■■■ dinosaurs.
The climate in the mesozoic was warm. Considerably warmer than now, but by no means uninhabitably warm. Why so? Well, there was a massive greenhouse effect, wasn’t there? So HM, I hear you cry, if there was a massive greenhouse effect shouldn’t the climate be much hotter and why is the ecosystem so rich?
Ah, grasshopper, but what is a greenhouse effect, really? a greenhouse effect is trapped heat. And not all of that heat goes into warming the air. Much of it goes into changing the phase of water. What this diagram DOESN’T show is water levels across this time period. For much of the mesozoic, a huge amount of thermal energy in the oceans meant that much more of earth;s water was in a liquid state. Sea levels during the mesozoic were generally (the mesozoic lasted for over 100 million years and levels changed over that time) 75 to 150m above what they were now. So that’s the flip side. You don’t get to say 'CO2 = plant food therefore increase in CO2 = more plants" and ignore all the OTHER impacts of CO2. If you have mesozoic CO2 levels and mesozoic temperatures, then you’re going to have accept mesozoic sea levels too (or at least something resembling them, there are other factors at play of course)
Similarly, the other thing you completely ignore is that there is no measure on this graph for biodiversity. fortunately, we can kinda-sorta approximate it by using the lines dividing geological periods from one another. Geological periods tend to (not with 100% consistency or accuracy, but a tendency) to be based on prevailing biotas. The dividing line between geological eras (or periods, or epochs) tends to be defined by a marked change in what we see in the fossil record.
Have a look at the graph above Note the major temperature changes, where the blue line steepens. Note that the steeper it is, the more likely it is to mark the end of a geological period? The temperature trough at the end of the Ordovician, or the dip at the end of the Devonian, or the trough at the end of the Jurassic, or the smaller more recent drops marking the end of the Oligocene and the Pliocene? Or the spikes that mark the start of the Cambrian, or the Triassic, or the Eocene. All of those represent major changes in the earth’s biota. They are major extinction events. Funny how often they correspond with major changes in earth’s climate, isn’t it? In fact, the only era-level boundary NOT associated with a temperature spike is the Mesozoic/Cenozoic boundary, where the extinction event was caused by an asteroid strike. And jeez, if CO2 was simple ‘plant food’ as you keep claiming, why do geological periods so often end (with a mass extinction) when CO2 increases abruptly? The end of the Triassic, for instance, or the end of the Jurassic? It’s almost as if what you say about increased CO2 greening the world and making it more fertile is … not true at all, isn’t it? As benfti has painstaking and fruitlessly explained to you. If CO2 increases significantly warm the world, sure, we’ll eventually see increased plant life in the biota because increased temperatures (that don’t range too far outside the biologically-functional window, and so long as liquid water remains available) mean more energy available for organisms to use. But that ‘eventually’ is ‘after a few million years once plants have had time to evolve to suit the new global conditions, and wave goodbye to the biota you currently have in the meantime’. If you’re pinning your hopes on feeding the world on a CO2-enriched agricultural sector, I hope you don’t mind waiting 2500000 years for your dinner.
And to briefly answer your questions…
Probably somewhere in the order of 320-340ppm. The pre-industrial level, basically. It’ll change naturally over time through geological processes anyway, but at least that change will occur across millennia rather than decades so the ecosystem will at least have SOME chance of keeping up by adaptation. We’ve already established that the higher CO2 = more plants line is rubbish, so nobody need starve to death unless our CO2 emissions trigger an extinction event that significantly effects our own food chain.
This is a stupid question and, once again, shows that you are unwilling or unable to grasp the distinction between weather and climate. But to attempt to answer as best I can - smoothed global mean annual temperature distribution should currently be approximately what it was 80 years ago. There are always going to be fluke years up or down, due to solar activity, volcanic activity, or years which may SEEM to be very extreme because one extreme of temperature is experienced in populated areas while the other extreme is way out to sea or around the poles. And maybe natural geological processes have shifted the mean a few hundredths of a degree. But, on average and long term, the mean and distribution of current temperatures shouldn’t be very much different to those of early last century. This is demonstrably not the case. The last time there was a single month that was cooler than average on a global level was 1985. That represents a temperature spike on your graph which is far steeper than any of the historical changes, and which puts us in line for a very scary extinction event indeed.
And all this really is utterly basic stuff and if you’re going to debate climate science and the try to bludgeon people with paleoclimate graphs, you really should know it already.
10 Likes
Faux offense at strong language coming right up.
I’d say so.
Your attention to detail is off the charts
As must be your pain threshold after all the bashing your head against a brick wall you’ve decided to continue to do …
![]()
Ignorant Illogical Science hating arrogant greedy stupid fckers gonna be Ignorant Illogical Science hating arrogant greedy stupid fckers, … and over so many years have clearly proven so.
Let them wallow in their stupid, there’s nothing to be done.
Oh no, if such a thing were to happen I have no ■■■■■■■ idea how I would possibly ■■■■■■■ handle such a devastating and cogent ■■■■■■■ critique.
2 Likes
“I don’t hate science.”
“Gee, relax mate.”
I do find that legitimately funny
Do you have some level of interest in why levels over 400pp is a problem? Wolfey?
Doubt it. To them it’s all just a big load. It’s peaked before. It’s something else. Who cares. Dodge, twist, spin, dodge.
Do wTs realise that before the industrial revolution, the time it took across all history for the carbon level to raise 10ppm was 1000 years. We have gone from 400ppm to 410 in 358 days
1 Like