Last year, I constructed a spreadsheet which calculates the average age and average games played of each of the clubs. Unfortunately, in constructing the new spreadsheet, I buggered up the old one and didn’t correct it in time.
It works on the 23 named for each game, so doesn’t allow for players injured or in the magoos (which is a way of people cherry-picking their list to include players who never play).
Not sure if you can do round by round, but how does it look specifically for the last two weeks, AT? It feels like we’re getting progressively younger atm, Shiel getting to play as sub notwithstanding.
Here’s a sobering thought - Melbourne fielded a younger side than us in round 3 & still beat us comfortably.
The age stat isn’t just about the kids, it reflects that fact that we have very few senior players. Heppell is the only available player that we drafted prior to the saga (plus Hurley who will almost certainly never play again). Pig, Melk & Ryder are the only ones we lost during the saga still on lists & Joe is the only other player from that era we might have still had playing if he didn’t leave. Again this highlights the fact that we drafted poorly before the saga can be used as an excuse. This is the age & experience gap we’ve tried to address through trading but with the exception of Stringer, the rest are completely letting us down for performance & leadership.
Average age is a pet hate of mine - every year some journalist trots out that metric and proclaims that an average age of 25.6 years is so much worse than 24.9 etc…
The problem is this metric is easily skewed by an experienced player or two.
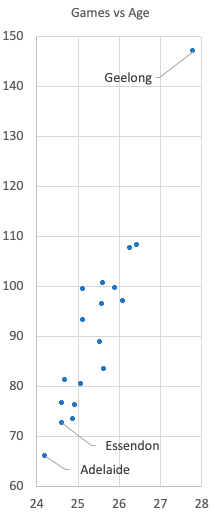
Imagine Joel Selwood played for us instead of Zach Reid on the weekend. Our average age becomes 25.2 and our average games becomes 87.3. Suddenly we are 9th youngest (older than Melbourne - disaster!) and 8th least experienced for games. Becomes a very different message, when in reality, we have only changed one player.
Dustin Fletcher used to mess up this metric for us.
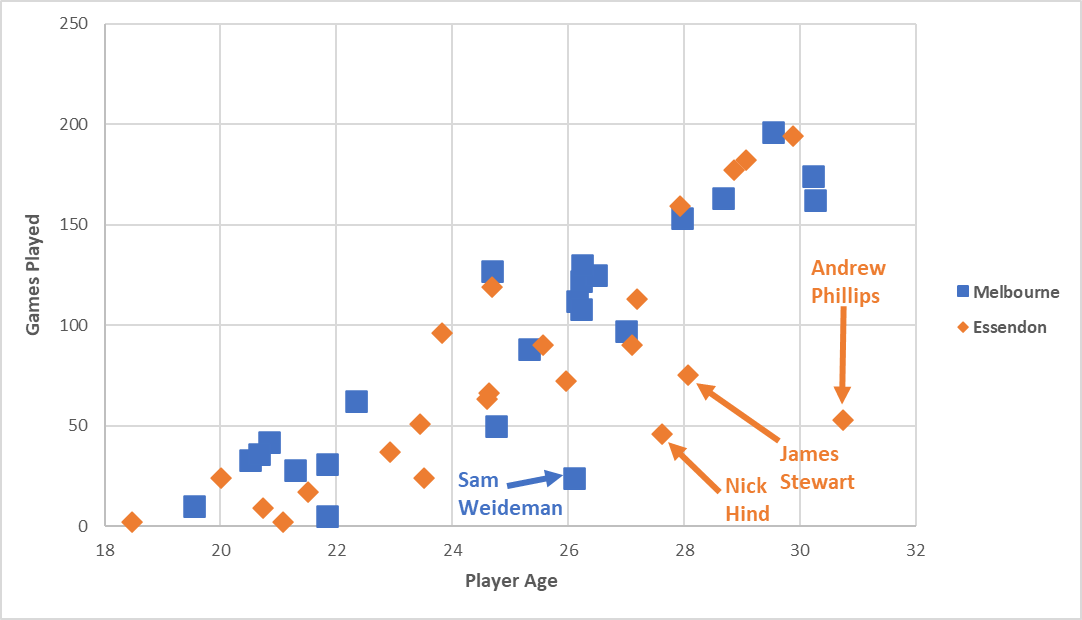
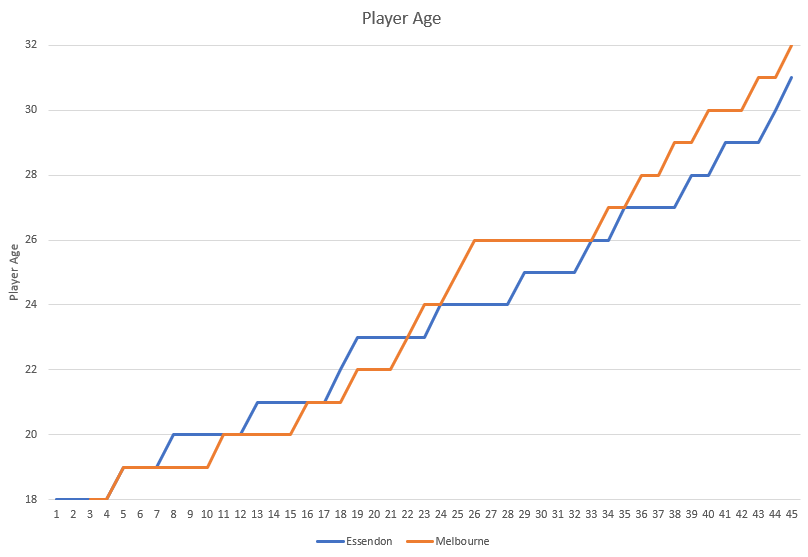
I think games played and age is an important metric, but a pure mean can be a problematic way of doing it. There is probably better value to be had in banding the players (0-20 games etc) or a combined age/games graph per side.
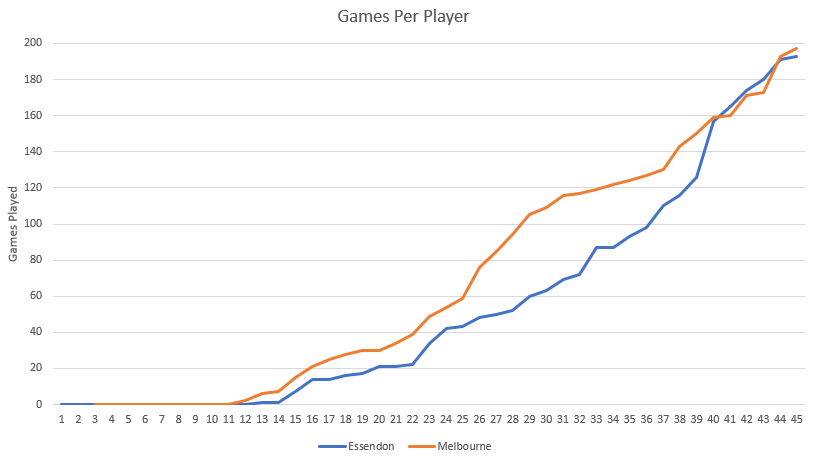
This is games played (at start of the season) for Essendon and Melbourne. As the playing lists are different sized (we have 45, they have 43) I’ve aligned it to the experienced end. (This is how it would look if Melbourne had 2 extra 0 game players). It’s clear that the Melbourne list is a lot more experienced. Total of 2444 vs 3069 games in total for each list.