Hah. Yep, because there was not much in the Essendon teams performance against the GCS to get obsessed about.
Not even the umpires performance.
You obviously get lots of points for smothers
I’m slowly working my way through the excellent ‘Footballistics’. The player ratings system is only mentioned in passing (it’s proprietary so CD won’t let anyone play with it) but it is mentioned, and has two unique attributes that other rating systems are unable to achieve:
- it has x, y coordinates for all possessions and disposals, factoring in as well where other players are and the overall field position
- it is able to make distinctions about the type of pressure a player is under when taking possession, and value the resulting possession accordingly
So what scores best? I’d guess something like winning a ball in a contested situation and disposing of it effectively in a way that improves your overall field position.
1 Like
I suspect that is actually where CD fulls down.
Is this a book you are reading? Linky?
https://shop.abc.net.au/footballistics
I picked up my copy from Readings Carlton.
Its no ‘Moneyball’, more a like a collection of blog articles but with better access to comments from insiders and has generally much bigger data sets. Includes contributions from TheArc, figuringfooty, matterofstats and others.
2 Likes
Cheers for that
I am a few chapters in, its well written and quite easy to read. Enjoying it so far!
Can someone out there in Blitzerland please answer this genuine question: Of all the stats and data sets that are now being kept, which one translates to the most wins?
And no, l don’t mean most goals kicked etc.
There is a chapter on this in the book. The two base stats that correlate most strongly with wins are kicks, and inside 50s. The winning side wins those stats over 75% of the time.
Of course, this doesn’t factor in gameplans that emphasize certain aspects of the game. For instance, the Pies are much more handball heavy than most sides and rarely win the kick count, while Melbourne “bomb it long” and rarely lose the inside 50s regardless of the result.
There is a short but interesting piece of analysis trying to link certain stats to different teams over the past three seasons. The Dons are a little unusual in that the number of running bounces we are able to take is a strong indicator of success, whereas it’s usually not a clear indicator at all. This doesn’t even include the “Saad factor” of 2018.
2 Likes
Not surprising given that we have been recognised ( and criticised) for launching most attacks from half back, due to having a poor midfield. That is, until after the infamous Carlon loss in round 8 2018, when our midfield got its act together, and our forwards started locking the ball in more effectively, which is of course the conventional wisdom of how to play footy in 2018
Not sure that I agree with all of this but it was an interesting read…
2 Likes
I’d say that’s a better way of lookin at it anyway. There will never be one things that is the way to success. Sides will have styles based on their list make up and quality.
Must be that if you let us run and give us space to do it we carve you up.
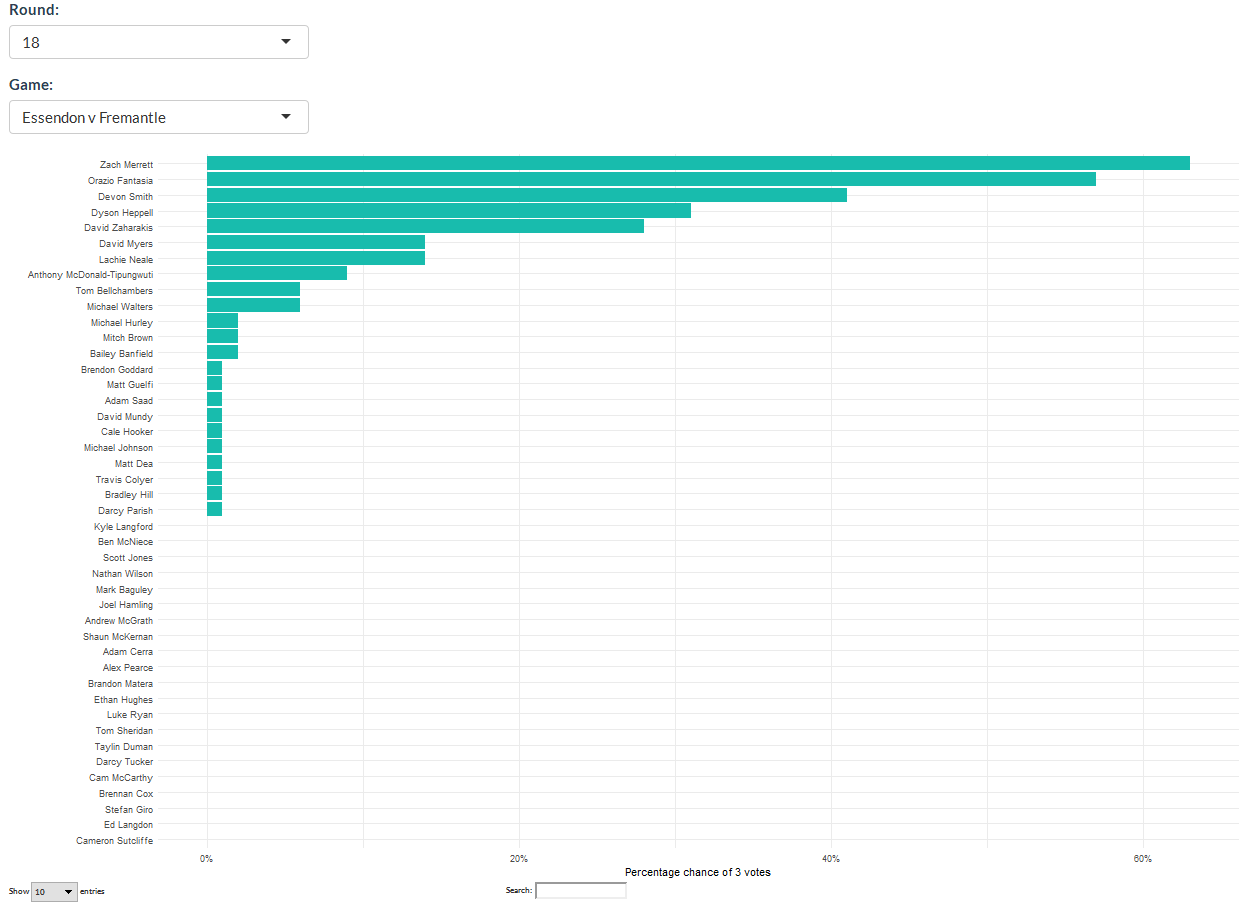
A screen shot from my brownlow predictor for this week. One of the issues with stats as they stand is that I can’t input when they are obtained, and I think Zerrett is a prime recipient of this. Fantasia and Smith for me were the best on field for us and will get 3-2, and then ZM.
Another comment is the low overall probability (~60%) which means noone really had a 3 vote brownlow game. I agree with that.
1 Like
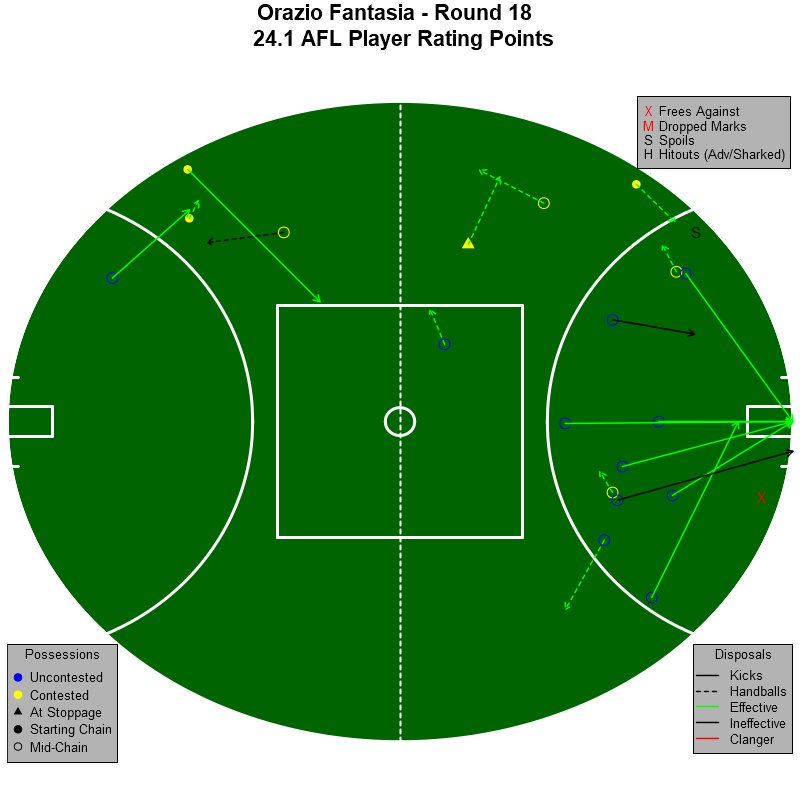
CD had Fantasia as bog. They provide a detailed account of the best player each match.
Beautiful game from Fantasia. Very few clangers, creating angles and kicking sausage rolls.
2 Likes
The stat I’d really like to know is the ratio of
EFC tackles : EFC free kicks for due to holding the ball or incorrect disposal.
and compare that to other teams.
Even I don’t need stats to tell me that, amazing, for once CD got it right.
1 Like
One of the reason I enjoy stats blogs, that I noted in the OP, is that they often allow you spot trends well ahead of time as they pay attention to more than the ‘4 points’.
Last time Essendon met Sydney the Squiggle had them as unbackable favourites:

The Swans had been just about the best performed team in the 2nd half of 2017, while we’d limped into the finals on the back of a very easy draw.
Yet this time, it’s a very different story.
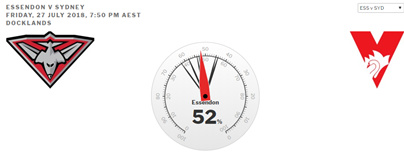
Why the change?
- We are underselling ourselves. Our last two matches were very convincing performances from a statistical point of view. With huge wins in the key Inside 50 indicator (which was our problem child in 2017) , +26 vs Fremantle, +19 vs the Gold Coast. We also only lost this by 1 vs Collingwood who are, like it or not, one of the form teams of the competition.
- The Swans are trash. I’ll let the blog post do the talking, but their results have been trending downward since the bye, it was just the Gold Coast game that made us wake up and notice it.
4 Likes
It would have to be really low, maybe half a dozen or 10%. Not sure if I’m alone but I feel majority of our frees come from marking contests which at times another teammate marks so the free kick doesn’t even matter
2 Likes
This is where the game needs to go…
I see no referring to Dale Thomas squibbing a contest so it has work to do