There have been multiple topics created on defence, so apologies for creating another one. Thought some might be interested in the charts I have created.
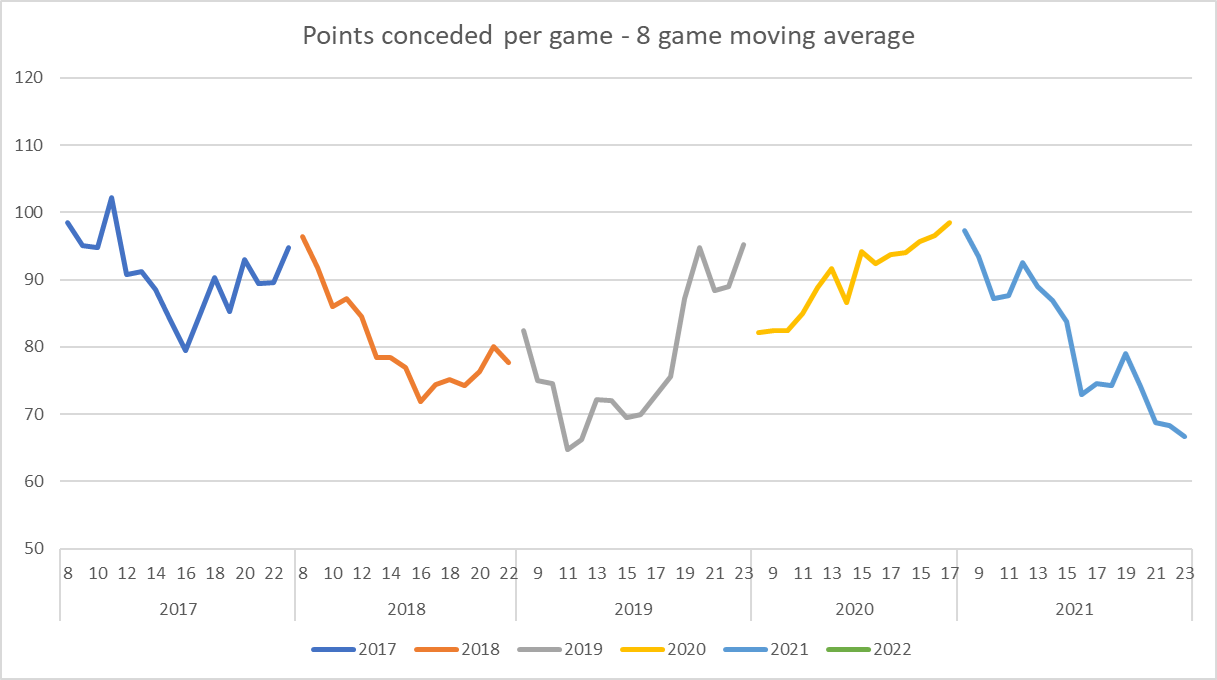
Below I chart average points conceded per game from 2017 to 2021. I show averages as the averages across 8 games, so you can see the broader trends more clearly (so for example at 10, we see the average points per game across games 3 to 10).
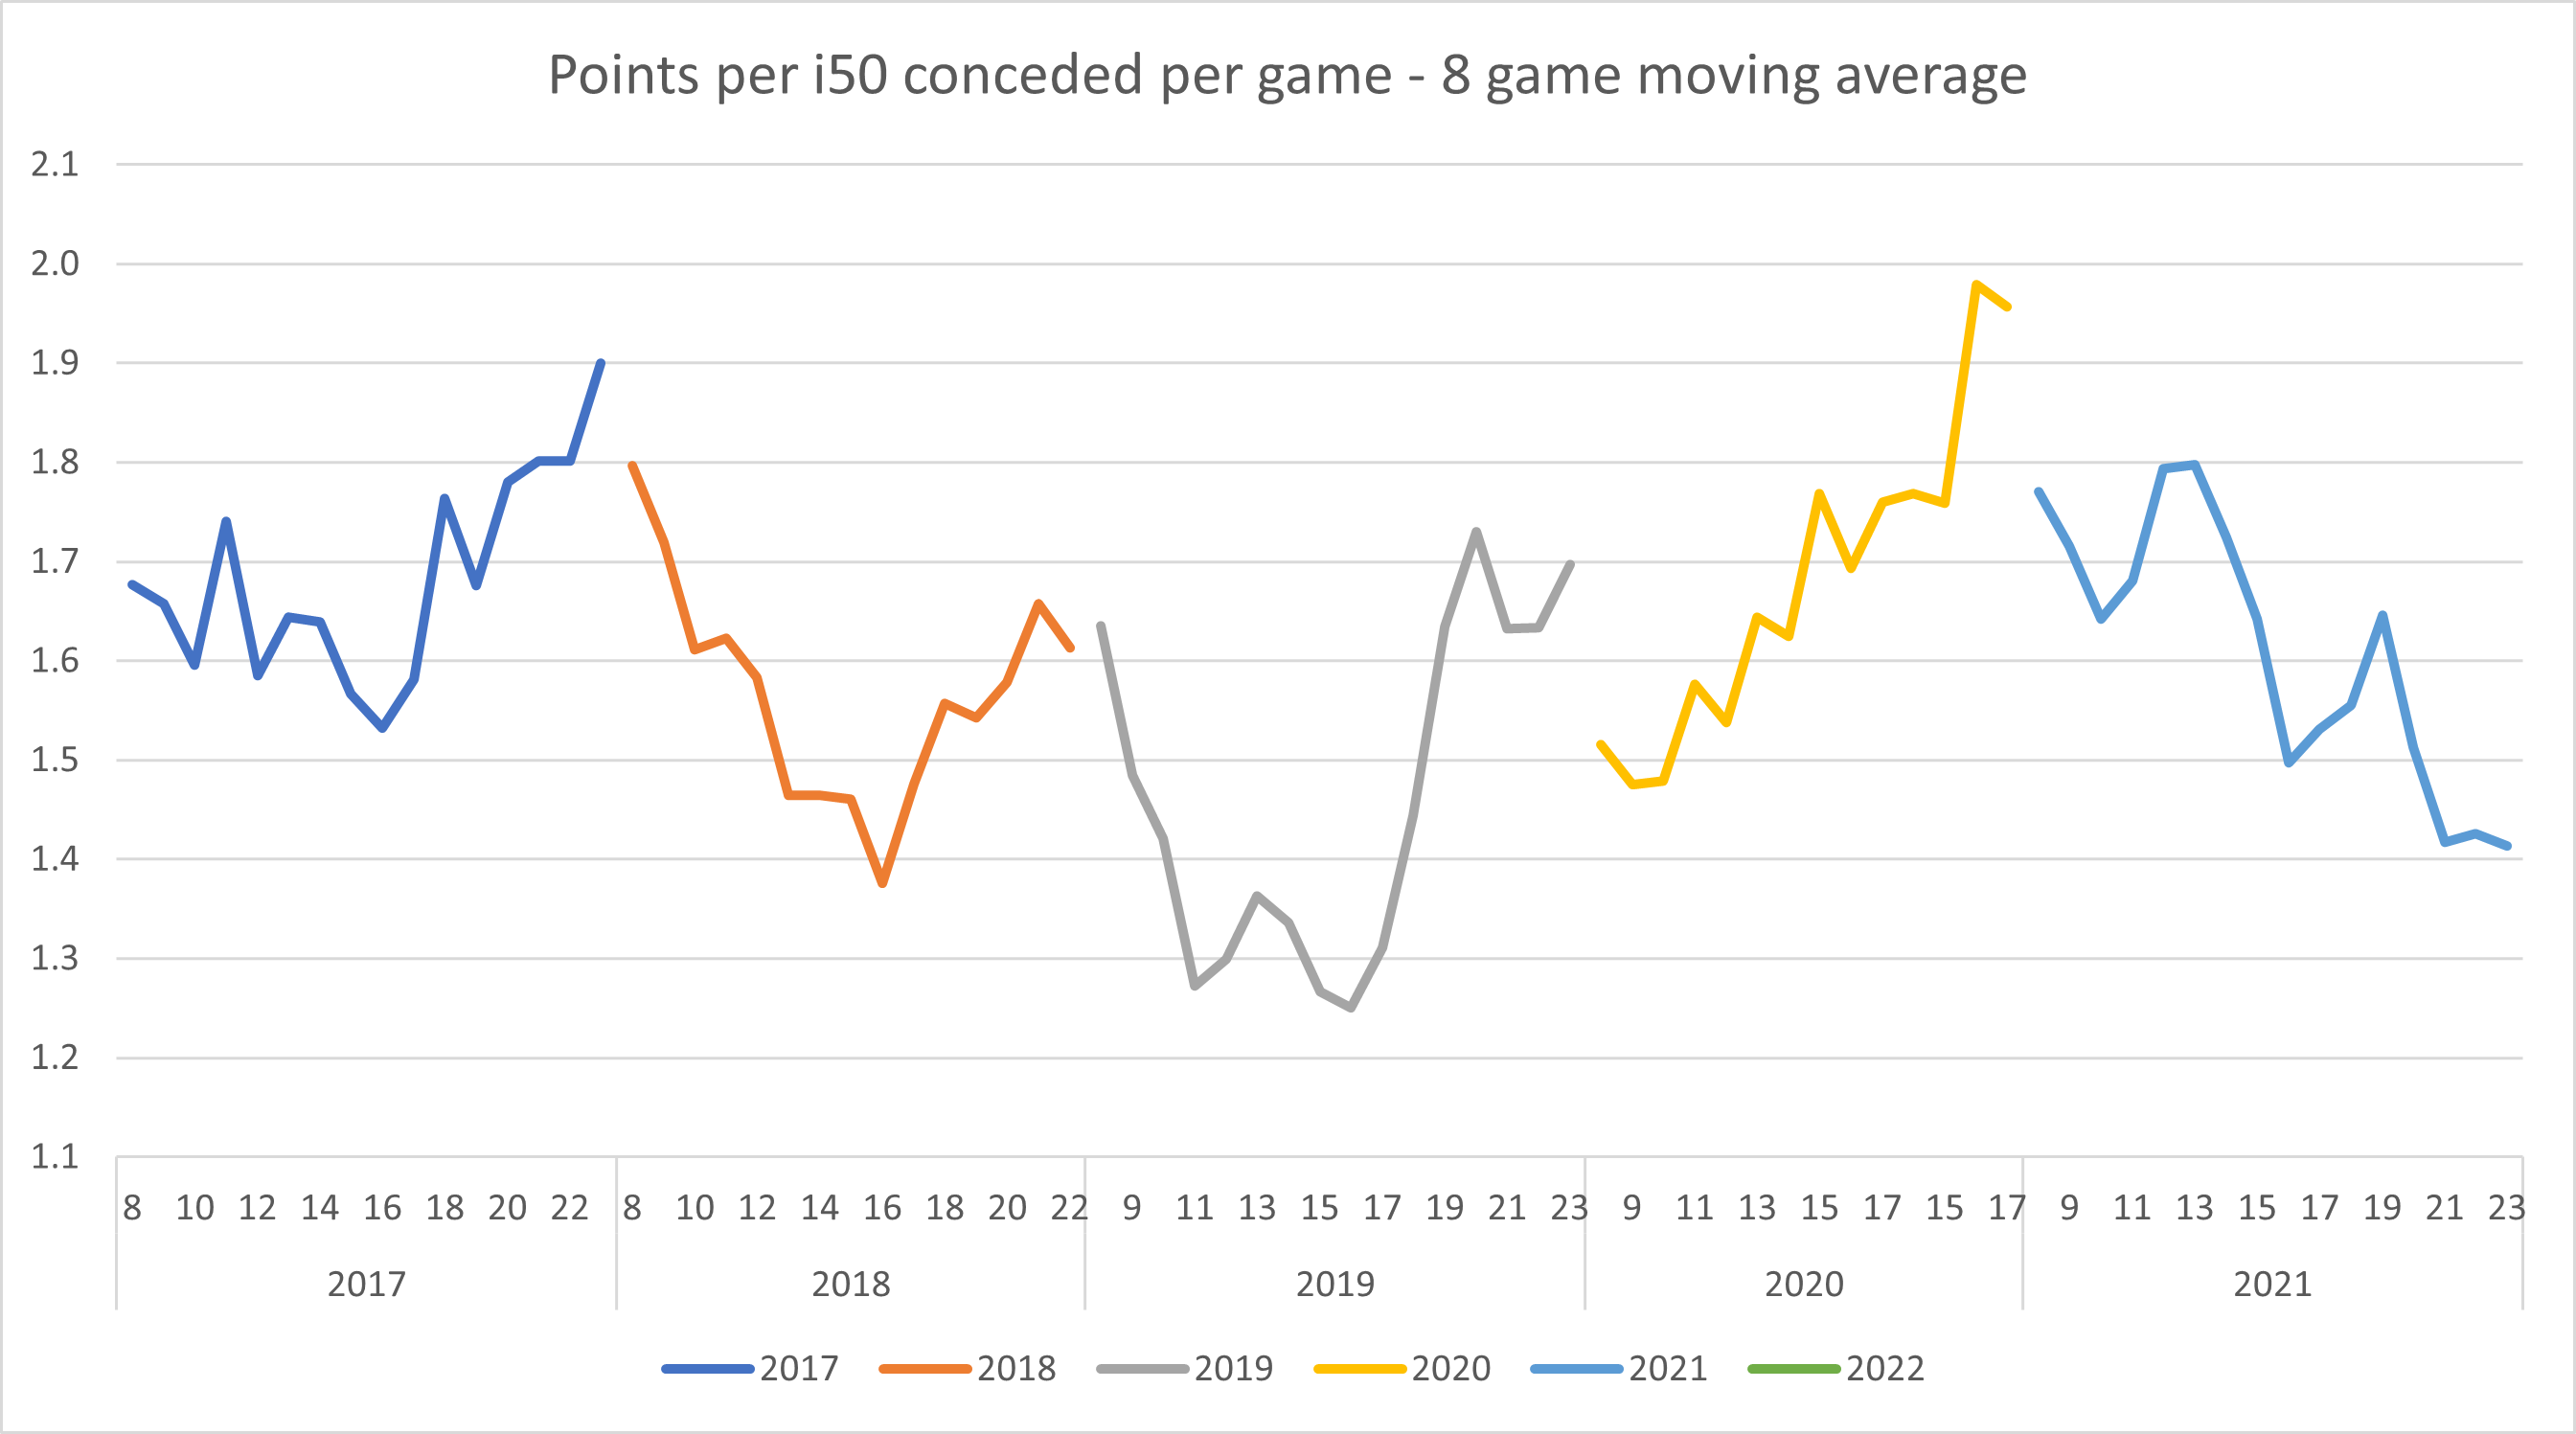
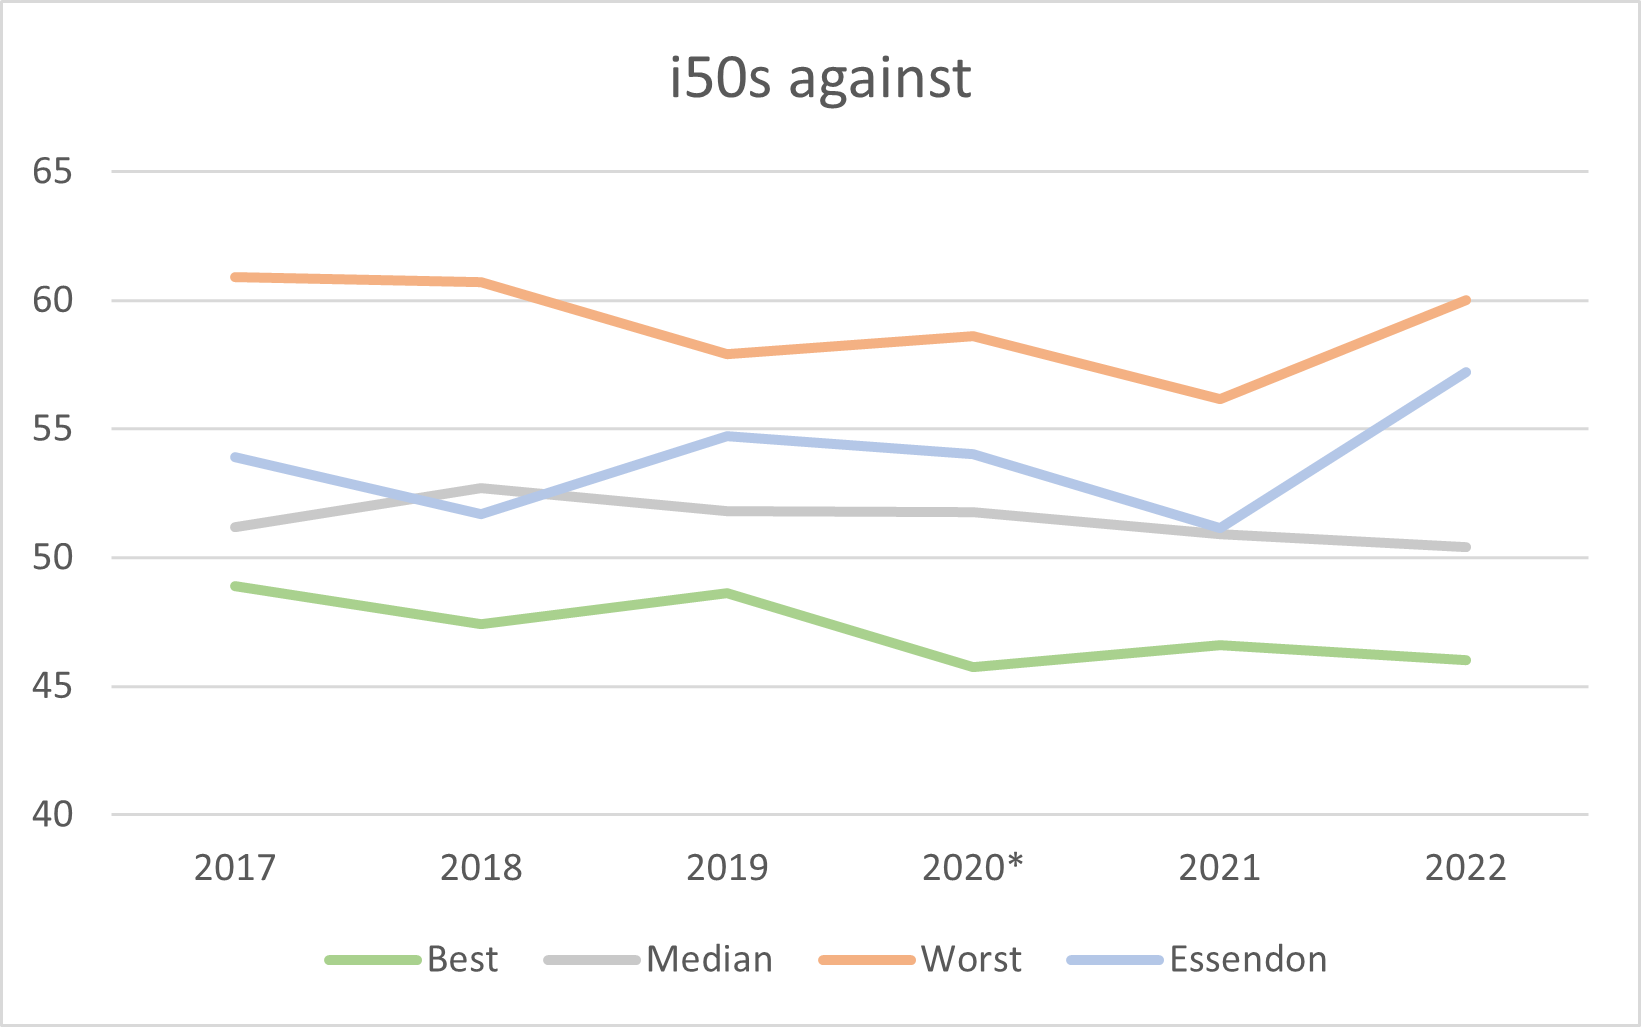
I also show the same for inside 50s conceded and points per inside 50 conceded.
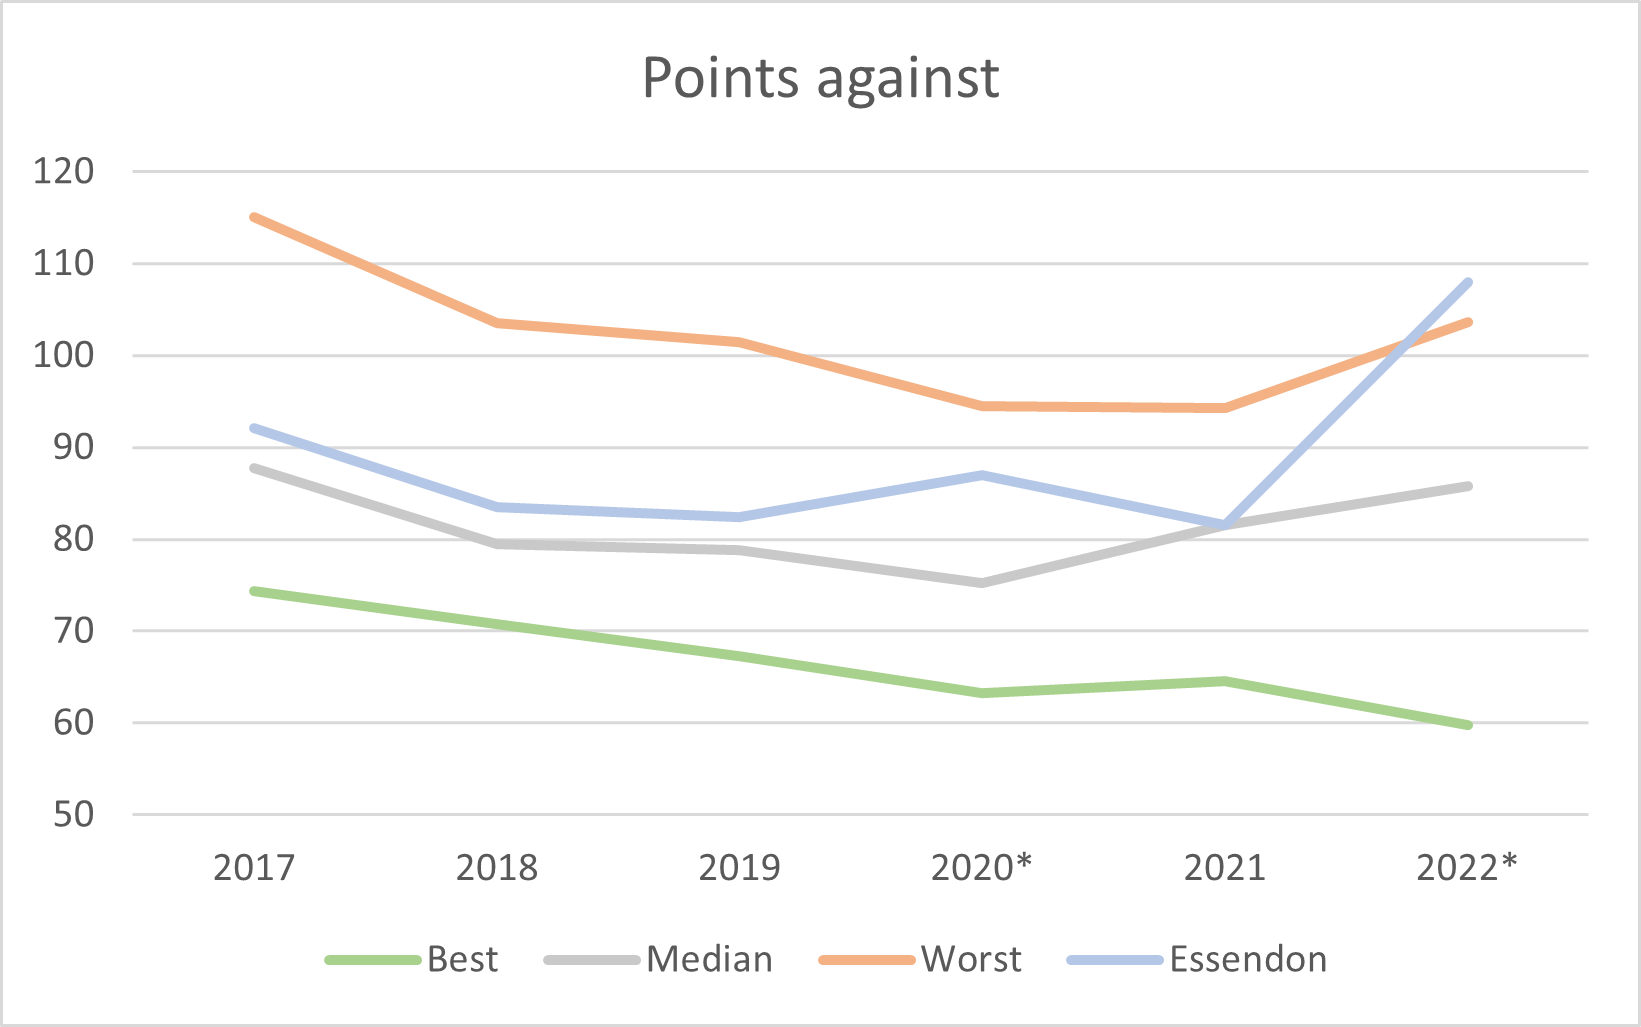
Note that I have (rightly or wrongly) adjusted 2020 stats for game duration. I can update this once we are further into the current season if people are interested.
Yeh. there was a very good balance between half back run, intercepting and hard lock down. A great defensive spine. Right now the spine needs Reid to fulfill his potential as a Hooker replacement.
In 2019 we attacked through the corridor off half back with 2 fantastic runners. Now Redman is about all we have left. Maybe McGrath can provide some run off half back.
But I think the mood of the coaches is to really tighten up the defence and move to territory dominance and locking the ball in the forward half.
Its a massive change in game plan since 2019 and one that will make us a far less exciting team to watch.
If we’re doing requests, it might be interesting to see what that looks like as a +/- compared to the average points scored by the opponent in that year, rather than as the absolute points against.
Edited for more clarity around what I was trying to express. At no point have we got ‘ahead’ of the median line.
The back end of last season was better but other than that… we have been pretty poor at both defending D50 entries and then defending scores when teams do enter D50.
I distinctly remember at the time I read this article, thinking the we hadn’t played much in terms of opposition and that the numbers were misleading. Hindsight is 20/20 etc etc, and I know we can only face the teams in front of us, but…
To the point the article was written…
Freo game was a Ross Lyon arm wrestle
Sydney game at the SCG was the same
Carlton were just trash at the time and they kicked 4 goals against us in the wet at the MCG
North were also trash and we smashed them on Good Friday
Brisbane were also trash at the time and Walla kicked 7.
Anzac Day we got screwed by the umpires in an area wrestle that we never really got under control after getting jumped early - much like Monday.
Keep in mind that 2019 we also got smashed by GWS in round 1 (112-40)
Gave up 112 points v Melbourne early in the season (Round 3)
Staggered and scraped 5 wins in a row mid-late season (North/Gold Cast/Sydney/GWS/Adelaide) only to end up being belted by PORT (gave up 126) and then the Bulldogs reemed us at Marvel (gave up 137) and only kicked 4 ourselves.
I think those numbers can be misleading. It’s not like we were giving up 75 - 90 points each week. There are some pretty huge outliers there.
What I’m saying is (again, there’s no wheel reinvention here and everyone knows it) we have an extremely soft underbelly when things get too hard. We can defend OK (just OK) for periods in games, but we can’t sustain it against good teams and haven’t been able to for a long time. Quarter to quarter, week to week, season to season.