Fletcher and Hooker ran/run much less distance than their opponents.
You can prove anything…
Fletcher and Hooker ran/run much less distance than their opponents.
You can prove anything…
Yeah i don’t think there’s any hard and fast rule. Just commenting that it’s not necessarily a red flag because the winner usually runs less kms (on average). It’s definitely a red flag in games like like round 1 against GWS when it looked like they ran rings around us.
I do think looking at one game win or loss. The distance run stat doesn’t tell you much on its own.
But the fact that stat has been lower then the op every week, and that we have lost more then won. Its a concern.
If we had won most games and it was lower I could understand. Some teams structures make them more efficient. Plus you haven’t had to chase as often.
That seems to me to indicate it’s pretty much meaningless.
tells me that we should in fact be sprinting less!
hahaha
As I said
BWAS wrote this 3 weeks ago, commenting on games 2 weeks before that. Absolutely spot on. Work rate down over 5 weeks all up. Soft tissue injury rate up, there is something seriously wrong.
Most of the goals Richmond scored were from our back half turnovers.
During the game I was amazed that when Richmond had the ball we were nowhere near them, when we had the ball, invariably there was a crowd of Richmond players at our throats.
Combine this with trying to “attack” off half back and we gave the ball up.
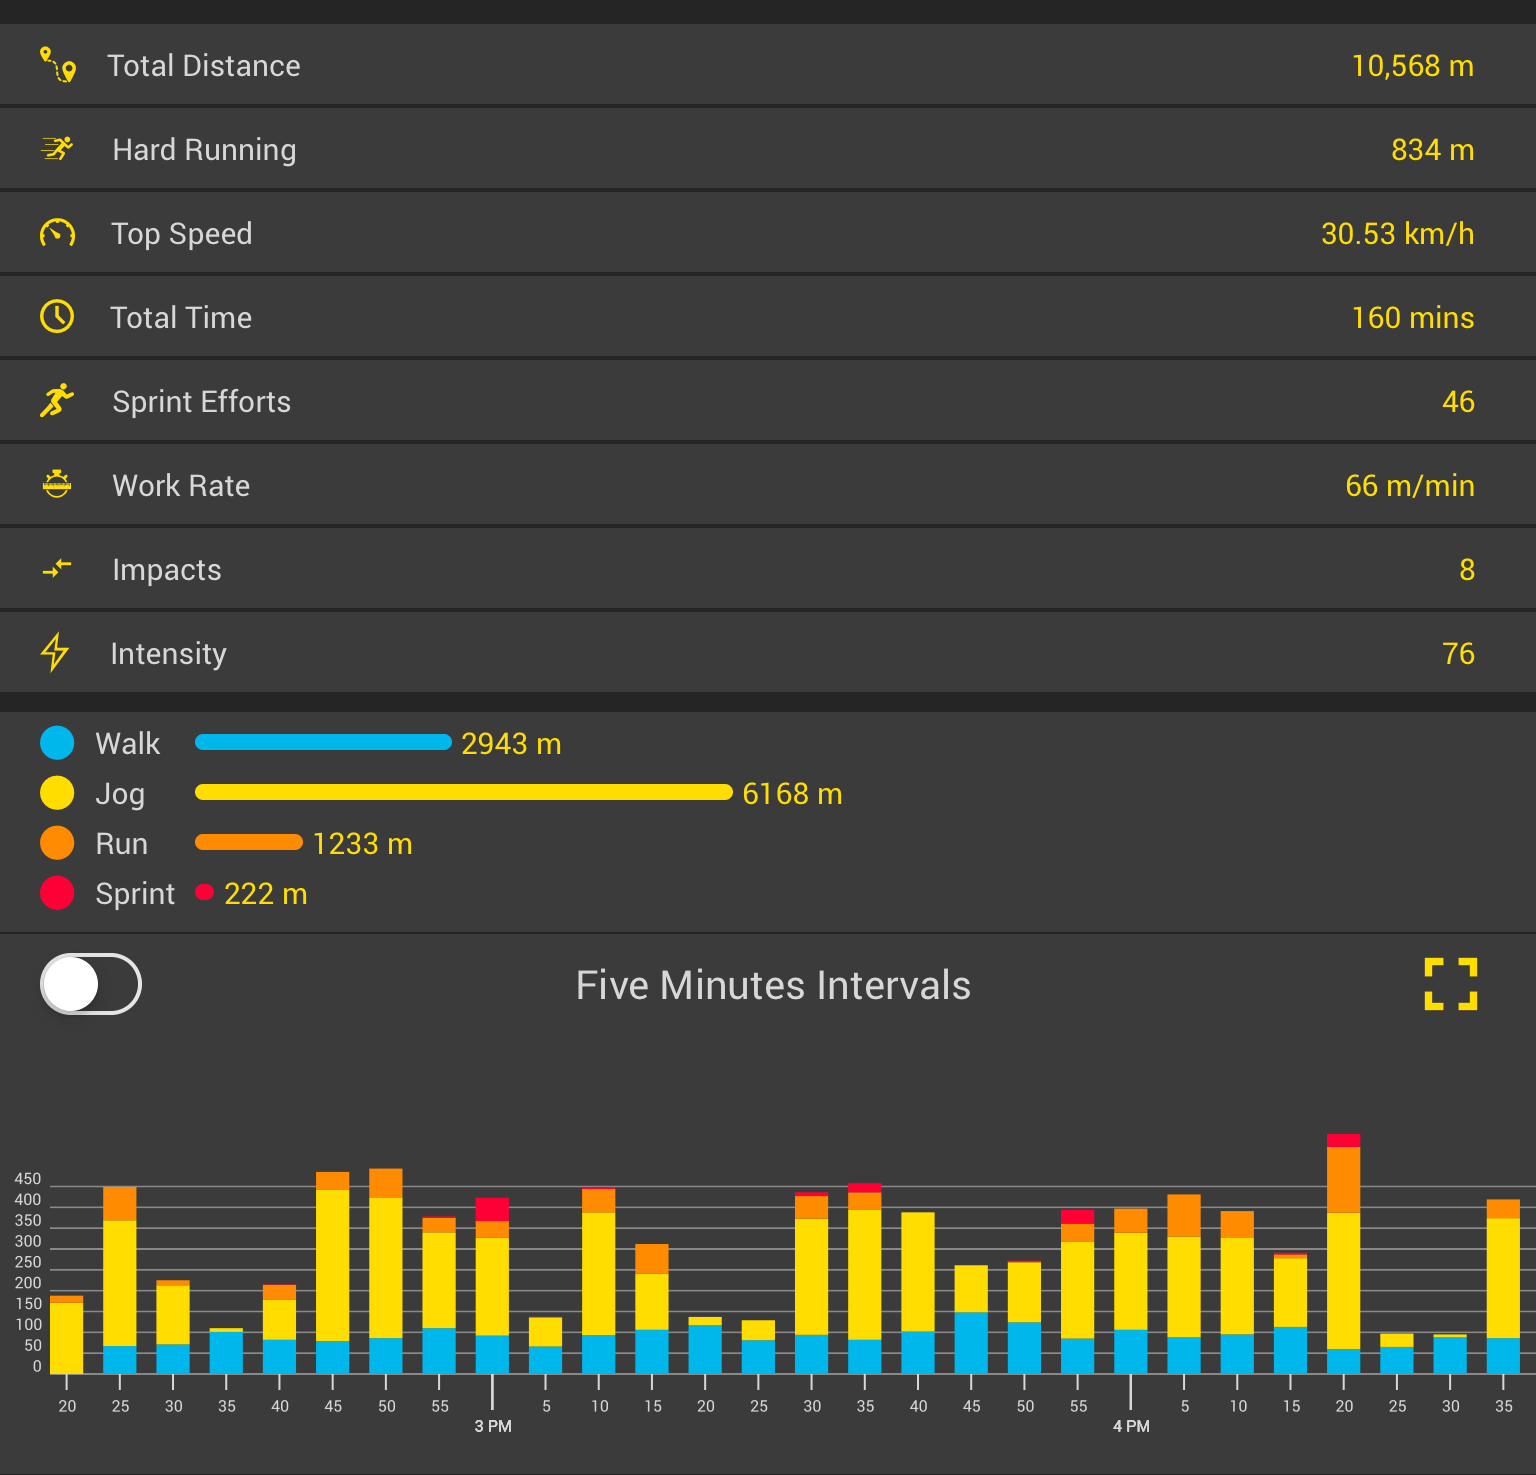
Looking at the AFL Tracker, there is not one category on the AFL tracker where we lead, sprints, Richmond, Repeat sprints Richmond, Km at high speed Richmond, km run, its all yellow and black…
The only Essendon player who appears in any of those categories was Heppel.
This has been happening every time we lose.
Then there’s the soft tissue injury cluster we have.
WTF has happened to the team and our players?
Lost the distance ran again by 6kms.
Serious serious issues with our fitness
Anyone who went to the VFL on Saturday also notice how Richmond VFL also ran all over us.
They should have had about 3-4 out the back goals as they had about 4 on 2 on the counter attack to their goals.
Does anyone know what tech we’re (meant to be) using?
All of them seem to have slightly different cut offs for sprints, collisions etc
The one I use also has different settings for the above eg last game recorded 41 sprint efforts but if I adjusted that it’d probably get halved or quartered.
Also don’t think an overall km counter is that great either as the individual nuances of the game would alter that week to week substantially (game before the screen shot we won by 100 and I only clocked up ~8.5km and 20 something sprint efforts)
a) We had two less players for half a match, that’ll impact it.
b) It is less than 300m per player across an entire game of footy, or about 80m per quarter.
Here comes the boring nerd with “maybe distance covered doesn’t mean anything”
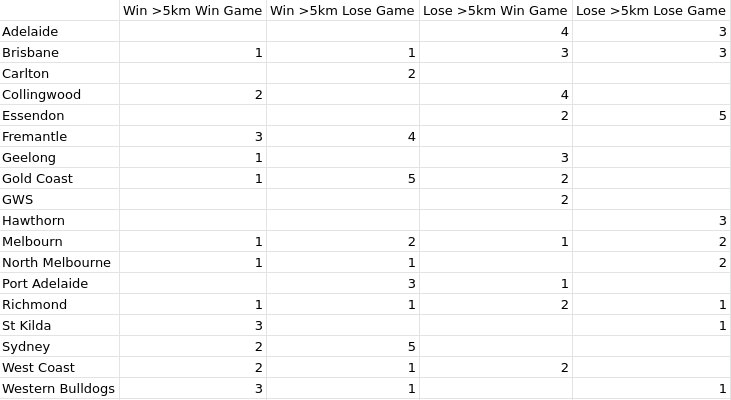
90 games so far this season, 47 with a total distance covered difference greater than 5km (arbitrary cutoff of a meaningful difference). So basically half of games have a 5km or greater difference.
Lose the distance covered by at least 5km and win: 26 (55%)
Lost the distance covered by at least 5km and lose: 21 (44%)
Biggest differential: Essendon lose by 25.2km and lose by 32 points. Second biggest differential, GWS lose by 24.5km and win by 41 points.
Edit: for what it’s worth, the percentage stabilises at about 60% from 7km+, so if you lose the total distance covered by 7km or more, you win the game 60% of the time.
The stats don’t tell the whole story but they can clarify what you see.
Watch the match and see the difference between us with the ball, playing one on one with a Richmond outnumber around us sticking tackles, and Richmond with the ball, chaining down the wings unopposed. They were faster and outspread us, and when we spread, they stayed with us.
They turned us over in our back half . Or they got the ball forward of centre and had a lot of overlap run to finish off.
Interesting, but this is AFL wide where teams play different styles.
We rely on run and carry, that’s our go to game style we want to implement. Theoretically, we need to be winning the distance battle because if we are playing at our best we are running.
GWS like to use their skills, so lots more kicking. They are the number 1 kicking side in the competition, which means they run a bit less whereas we are number 14 kicking side, and number 7 handball side.
It’s more of an imperative that we do win the distance covered battle due to our game style.
But is what you see reflected in the stats? We were absolutely gassed against the giants, lost by 2.5km. Ran all over melbourne, lost by 14.6km.
And just to clarify why they appear faster than us.
When they spread and start distributing the ball to their teammates, they hit them on the chest. That player doesn’t have to stop/slow and lose momentum, he just handballs to a player who also just keeps running and passes off etc etc.
If you look at when Essendon do one of our trademark runs from defense to attack it is rare that it will not involve a kick/handball that makes the receiver stop/backtrack/bend down to pick it up etc.
We can still score from them but we make the easy look difficult because of our atrocious skill level.
I think the more telling stat is the number of sprints made by the teams’ players.
Affected by who has the ball, of course, but also shows effort/desperation levels when defending, and spread and discipline when attacking.
Who else would you put in the run and carry basket like us?
Oh, and just to be clear: I’m not saying we don’t have a fitness or workrate problem, just that if people are going to use stats as evidence for that, they need to be given in some sort of context for what other teams do, whether it correlates with winning, etc.
We have the most players called Cale in our best 22, I don’t think the problem is players called Cale.