a thread about excuses. nice.
if this is some handy script that can easily be ran over different sides, could it be run over the bulldogs in 2016?
we can do better.
a thread about excuses. nice.
if this is some handy script that can easily be ran over different sides, could it be run over the bulldogs in 2016?
we can do better.
Our 1993 flag side was about 4 months per player younger than our current season’s sides.
About 85.35 games per player.
Different rules, of course, about the age players could start.
Personally I think that median games and age is better than average. Gives a better picture as not as effected by outliers.
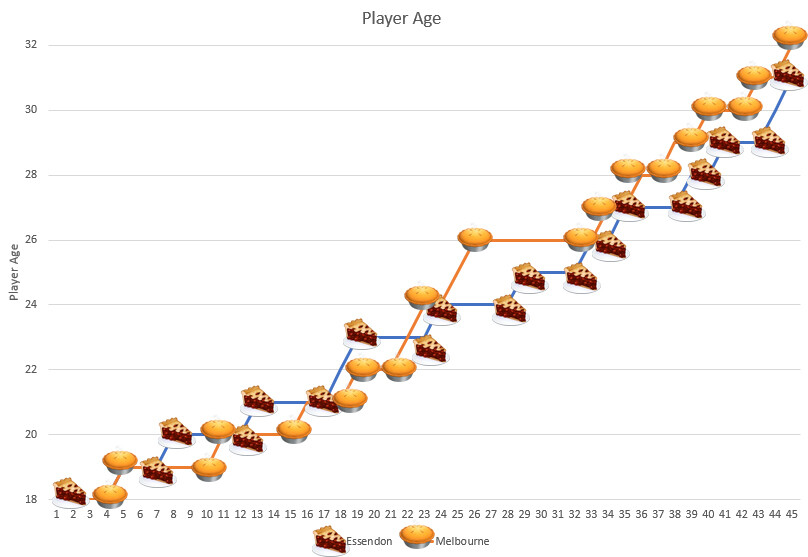
Why are there no pie charts
‘Cause we’re not ■■■■■■■ savages.
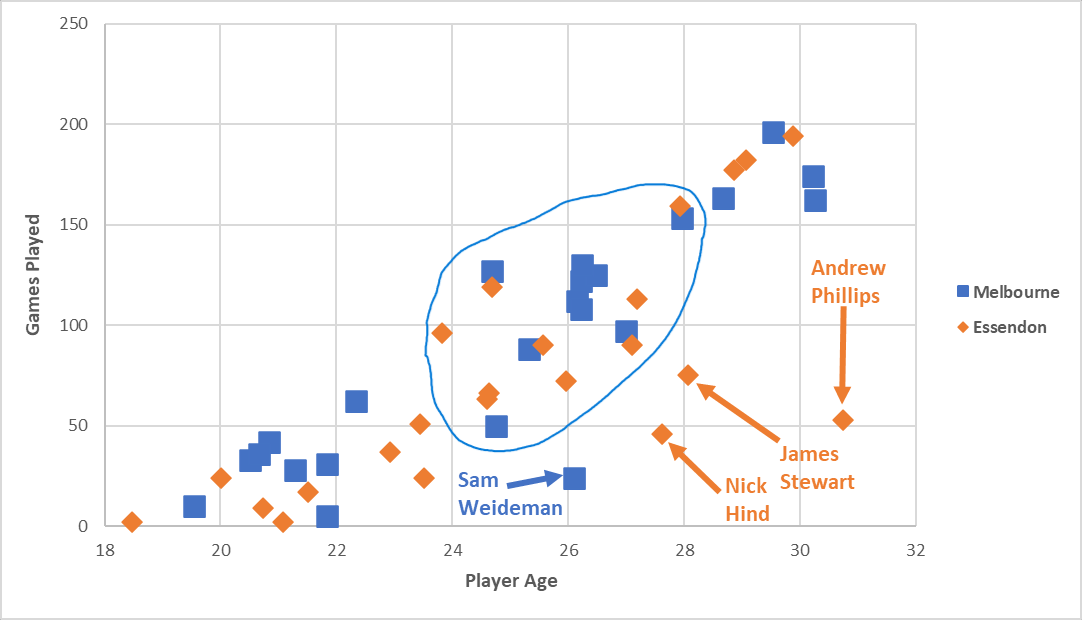
Another factor is simply the amount of footy played together. Take the circled area of ~24-28y with between ~50-150 games.
Melbourne have 10 - of which 8 have played together for their entire careers (Ed Langdon and Adam Tomlinson both started at other clubs)
Essendon have 7 - of which only 2 have played together for their entire career (McGrath and Parish). Smith, Stringer, Cutler, Kelly and Wright all started at other clubs.
Unfortunately, there are a lot of manual calculations to get the median.
And I know there are all sorts of stats you can generate, but most of those are just cherry-picking to make your club look the best…or most hard-done-by.
And I’m not doing any of them.
Excel has a neat median function for this:
=median(A1:A30)
where A1 and A30 is the range in question.
FWIW, median games (at start of season):
| Club | Games |
|---|---|
| Essendon | 34 |
| Melbourne | 54 |
| Geelong | 61 |
| Carlton | 48 |
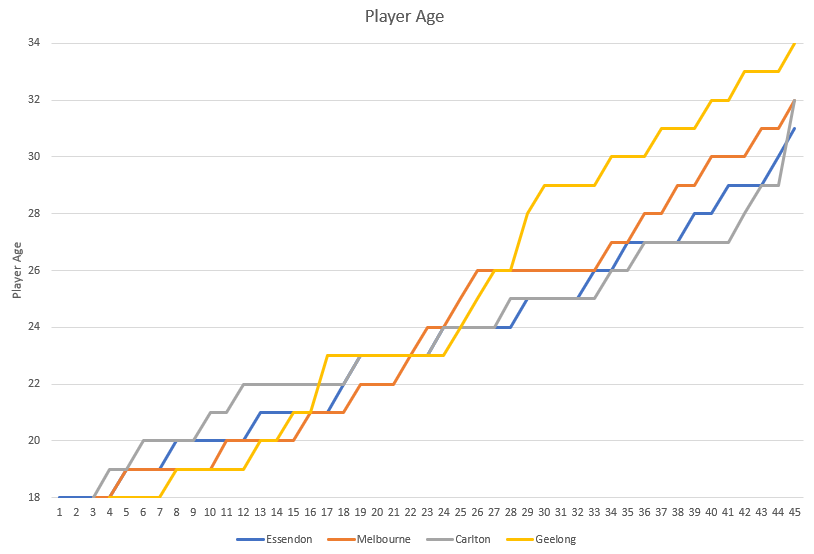
And median player age (calculated in whole years). Not a useful metric imo.
| Club | Age |
|---|---|
| Essendon | 23 |
| Melbourne | 24 |
| Geelong | 23.5 |
| Carlton | 24 |
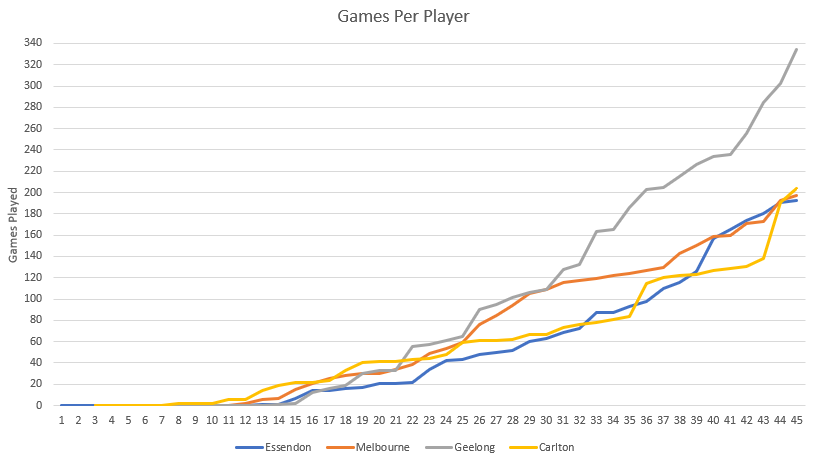
This is games per player - have a look at the experience on the Geelong list. 4154 games, vs 2444 for us at the start of the season.
Same for player age.
Stats are interesting for lots of different reasons.
Yes we are a young side and yes we are inexperienced… but we are not ‘dramatically’ lower… we are underperforming.
What it highlights is that we have not done a good job at building the list and we haven’t retained talent at the top end.
We didn’t play the kids enough under Woosha and we are paying for it now… that is why our average games played is so low.
Overall we are in a poor position in terms of list balance and team cohesion.
On the other hand, there are those who think the thread title is a tautology.
Which kids are still on an afl list that woosha did not play. I’m not convinced that our kids under Woosha were that good.
Draper should’ve been played from early 2019. Same for Francis in 2018
Langford was Woosha’s scapegoat for a couple of years as well. Parish was dropped a couple of times too from memory. I think Ridley was the scapegoat after the disaster 2019 GWS game too
What I’d need to do a lot is to get a CSV with Player Name, Player Number, DOB and Games Played (start of year).
Then, whilst it would still take a lot of manual work (entering a flag to show whether the player played that round), I’d be able to do all these stats.
This bit is easy - https://www.draftguru.com.au/lists/2022/essendon draftguru is brilliant for this data.
This could be done semi automated using AFL tables. Copy paste in the team lists and use a quick vlookup. I’d reckon with a little bit of thought it would be ~10 minutes a round.
A much better way would be to use something like fitzRoy - https://jimmyday12.github.io/fitzRoy/index.html which would scrape the data for you. This is going down the rabbit hole…
If you just want to use AFL Tables data, it is all HTML tables and stored on URLs generated using a year-teams-date system.
I don’t know if fitzRoy scrapes the data needed, but it could easily be done (and automated) using rvest in R or pandas in Python. There is probably also some way to automate it in Excel but I have never done that before.
Link whatever table on the website as a data source. Then refresh each time you open the file.
Congratulations people.
Time to change the Thread title to “Some really really boring discussions about how to code for stats”.
Next level work.
I’ll have to look into these suggestions. There’s a lot of new functionality in Excel365 that should make these calcs straightforward.