The Forest from the Trees: A post for the stats nerds

Pre-amble: This isn’t a thread for the “■■■ what can you udnerstand with teh statz” crowd. I get it, the numbers aren’t for everyone and that’s OK.

The last few years I’ve become obsessed with the small but growing selection of AFL statistics blogs that are hoping too, somewhat, emulate the analytics scene which has taken off in the U.S. There are two main reasons I enjoy these blogs:

  1. Oddly, for people obsessed with numbers, they tend to be 5x better writers than the usual journalist hacks that TheAge and the Hun trot out (does anyone think Robbo spends more than 20 minutes on his “likes” column of a Monday morning).
  2. There are a number of metrics and perspectives they’ve developed that give me a fresh perspective on the game I love.

A few of these blogs and posts have gone viral (if you haven’t seen the Joel Selwood free kicks graphs do yourself a favour) but a lot of the key insights have been missed.

Firstly, improvement is gradual. Teams having huge swings in form is very rare. Seems obvious enough, yet we miss this time and time again. The Squiggle, one of the more straight forward blogs out there that assigns historically weighted Attack and Defence scores, picked up that the Dockers were done (or well on their way to being done) in the middle of 2015. The reason? They were consistently “under performing” their expectations: i.e. they were winning by smaller and more smaller margins over middling opposition. The wins and losses columns hid this, but the trend was unmistakable.The loss of Fyfe/Sandi at the start of 2016 merely hastened an already terminal decline. The Hawks drop off wasn’t quite so severe, but by the end of last year they were well and truly “back in the pack”. For the record, most blogs had the Swans as a very good team despite the 0-6 start. Why? The losses had been close, often very close (they lost a 1 pointer this year), and the worm eventually turns on such losses.

This brings us to point two, good teams DON’T always win the close ones. Close games are a coin toss. In 2015 the Hawks looked vulnerable mid year after dropping a handful of games. They weren’t. In every indicator they were playing amazing footy but they’d dropped a couple of close games to inspired sides. In 2016 this turned, and a few close wins masked a serious decline. Margins matter, a close win or loss shows that the sides were very even, and this form must then be put into a broader context.

Point three, attacking football is good football. This is slightly more controversial, Tony Corke looks really in depth at the issue here. He is hesitant with his conclusions in a manner befitting a serious analyst, but states “in finals, teams that were superior offensively and weaker defensively haeve won slightly more than 50% of their games”.The Squiggle is less diplomatic. If you look at the profile of past flag winners in the AFL era, there is an undeniable skew towards teams that have serious firepower. Of course, great teams are very good both offensively and defensively, but literally only a handful of teams with a “defense first” mindset have won premierships, the modern Swans sides, the Bulldogs last year, and Malthouse’s Eagles are about it. You need to score goals to be a contender, and we score goals.

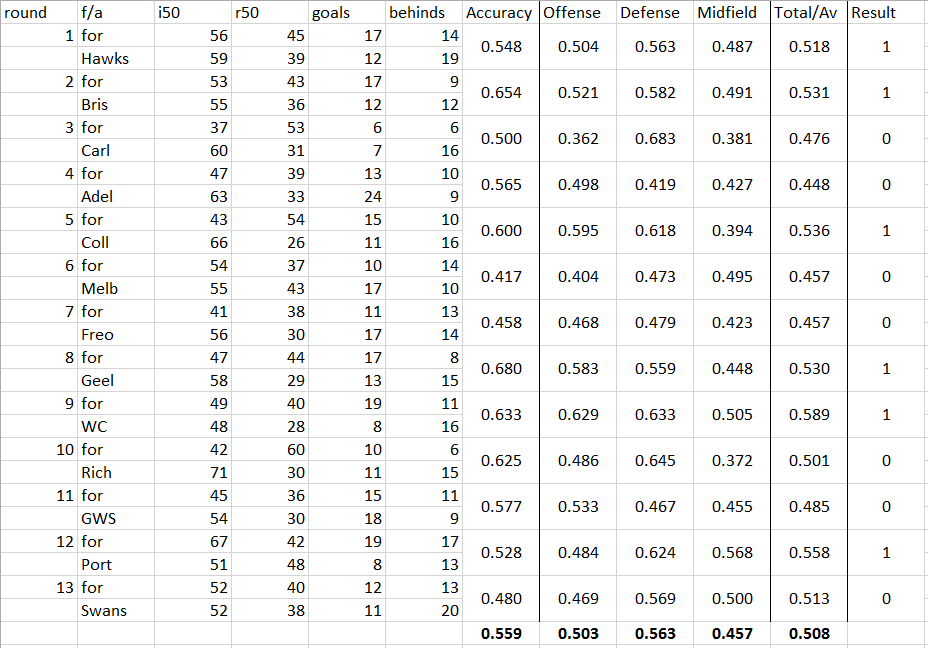
So where are we? We are trending up. We are a top 4 side offensively and defensively, but with a bottom four midfield. Our form line was up heading into this match, and despite not getting the four points this improvement has continued. We’ve had an incredibly tough draw, and we are now hitting our ‘soft’ patch in very good form. If we were a stock, the time to buy would be now.

55 Likes

How did I miss this… Oh yeah, I couldn’t read through the tears. Thanks a lot BBB, enjoyed the post.

1 Like

Great post. Loved it

1 Like

Great post.

I agree with the last part, they only thing we need to be careful of us essington. Our run honw, we only play 2 teams currently in the 8 (dogs and crows here) and only have one interstate game (GC). The lost last week really hurts because last week and this week sees alot of teams around us playing each other.

I’m generally pretty negative when it comes to us but we have played really well for the last 6 or so weeks except the Richmond game. We have run, good carry and disposal efficiency is up and I think that’s mainly due because we are finding space even on small grounds.

It also helps when you have 2 genuine key forwards to kick to plus a “gorilla” as well. Our defence is relatively young with a nice mix of experience and composure.

If we can not let our inner demons take over we can easily make the 8 even with the ordinary midfield we have and cause so havok in the finals.

We are basically where we were at the start of the season. Even Stevens with a percentage of 100%, literally middle of the pack having played a tough run. Really need to make this “easier” (or less difficult) run count. Our next 4 games are against
Lions
Pies
Saints
Dogs
The last 3 are against teams who will be competing against us for positions 6th to 8th on the table, need to win those 3 as well as beating the lions

2 Likes

This might be the best place for this. Not sure if the stats have been looked at this (in this simplified) way before. If so, I haven’t seen it.

Reasoning is that for every position area (defense, midfield, and offense), whatever other stats are involved, there are always two general outcomes (one positive, one negative). For offense, once the ball has gone inside the 50, it can either rebound back out (negative) or go through the goals (positive). For defense, it’s the opposite (rebound = positive; goal = negative). And for the midfield, you either get it inside your 50 (positive) or the opposition gets it inside theirs (negative).

Just because it’s easier to do, there’s a greater proportion of rebound 50s to goals. Seems like about 0.7 and 0.3 is the average respectively, so I’ve just added 0.2 to the offense result, and took 0.2 from the defense, so that 0.5 can represent ‘tied’ for all position scores. But will apply the average for all teams once I work that out.

Table below is just for Essendon (still in the process of doing up other teams). Seems if you win at least two positions, you win the game. And the midfield is definitely our area for improvement.

3 Likes

*forest for the trees…

1 Like

But with statistics, one can clearly see the the forest from the accumulation OF the individual trees. “Can’t see the forest for the trees” is a statement of the opposite. So I think it makes sense to flip the saying around.

Yep, … . Thought it was pretty clever m’self.

I think most got it ??

ahhh. deliberate play on words. fair play. carry on.

The first point in the OP talks about trends that show up in margins that might not be apparent in wins/losses. That is, the margin is important. It is similar in principle to a long held belief that a good indicator of which teams have really performed well is percentage.

Except that doesn’t hold for flat track bullies

It’s also been found that there is little correlation between years for the ability of a team to win the close games.

A point made, albeit indirectly, in the op

The Squiggle, and most such blogs, aim to adapt for that by factoring in the strength of the opposition. A 40 point win won’t impress anyone on Sunday.

While flat track teams do exist, I think it’s a little overplayed. It was a common charge against West Coast early in 2015, but they ended up in a GF (copped a hiding but).

Game plan matters a lot I think. Adelaide are going to an interesting test this year on the flat track metric. Can they pull off the run n gun when. It counts?

I reckon flat track bullies is far more of a thing for non-Melbourne teams than the Vic sides.
This year Port and Adelaide both have a percentage over 150% at home

Not sure I get this “Flat Track” tag.

In that instance, they would be “Home Track Bullies” no??

3 Likes

I think we’re trying to spell our name in binary.

Split that hair.

Does anyone have our quarter-by-quarter scoring trends? Totals and scoring differentials?

Because right now I’m feeling like we distinctly lack running power, and if we don’t bank a fast start, we regularly get overrun as the game lengthens…

1 Like

Was thinking about the exact same thing. It wouldn’t surprise me if Q1 our % was near 200% and q4 40%. Fitness is a massive issue.