AFL Player Ratings Twitter account provides weekly updates. They aren’t 100% comprehensive but give leaders by club/position/age.
2 Likes
So… I’ve admitted before that I am obsessed with the 'Contested Defence Loss %" stat.
Well, turns out, I still am. So I even started looking back at previous seasons, to see how this current crop compares. I even made another table about it…
Notes: Champion data started collecting this stat in 2013, and only has access for players still playing. So I couldn’t get numbers for Fletcher, Bags, McKenna or Dempsey.
Anyway, if there is anybody else on the planet who is actually interested in this stuff, this thread will be the place to find them.
| 2021 | Contested Defence One on ones | Contested Defence Losses | Contested Defence Loss % |
|---|---|---|---|
| Jayden Laverde | 58 | 13 | 22.4 |
| James Stewart | 41 | 12 | 29.3 |
| Jordan Ridley | 34 | 4 | 11.4 |
| Nick Hind | 21 | 3 | 14.3 |
| Dyson Heppell | 21 | 5 | 23.8 |
| Aaron Francis | 21 | 8 | 38.1 |
| Mason Redman | 18 | 6 | 33.3 |
| Matt Guelfi | 11 | 3 | 27.3 |
| Brandon Zerk-Thatcher | 9 | 1 | 11.1 |
| Zach Reid | 4 | 1 | 25 |
| Tom Cutler | 3 | 0 | 0 |
| 2020 | |||
| Michael Hurley | 44 | 15 | 34.1 |
| Jordan Ridley | 27 | 7 | 25.9 |
| Brandon Zerk-Thatcher | 27 | 11 | 40.7 |
| Aaron Francis | 23 | 8 | 34.8 |
| Marty Gleeson | 22 | 8 | 36.4 |
| Mason Redman | 20 | 8 | 40 |
| Adam Saad | 18 | 5 | 27.8 |
| 2019 | |||
| Michael Hurley | 58 | 18 | 31 |
| Cale Hooker | 55 | 14 | 25.5 |
| Patrick Ambrose | 51 | 7 | 13.7 |
| Adam Saad | 33 | 9 | 27.3 |
| Aaron Francis | 30 | 9 | 30 |
| Mason Redman | 25 | 14 | 56 |
| Marty Gleeson | 23 | 5 | 21.7 |
| 2018 | |||
| Michael Hurley | 76 | 21 | 27.6 |
| Cale Hooker | 71 | 16 | 22.5 |
| Patrick Ambrose | 25 | 9 | 36 |
| Michael Hartley | 22 | 4 | 18.2 |
| Adam Saad | 22 | 5 | 22.7 |
| Aaron Francis | 14 | 3 | 21.4 |
| 2017 | |||
| Michael Hartley | 84 | 22 | 26.2 |
| Michael Hurley | 74 | 26 | 35.1 |
| Marty Gleeson | 43 | 14 | 32.6 |
| Patrick Ambrose | 39 | 10 | 25.6 |
| Andy McGrath | 26 | 9 | 34.6 |
| 2016 | |||
| Michael Hartley | 76 | 22 | 28.9 |
| Patrick Ambrose | 45 | 9 | 20 |
| Marty Gleeson | 31 | 8 | 25.8 |
| Anthony Mcdonald-Tipungwuti | 19 | 9 | 47.4 |
| 2015 | |||
| Michael Hurley | 67 | 13 | 19.4 |
| Cale Hooker | 56 | 13 | 23.2 |
| Michael Hibberd | 31 | 9 | 29 |
| Marty Gleeson | 27 | 8 | 29.6 |
| Jake Carlisle | 19 | 5 | 26.3 |
| 2014 | |||
| Cale Hooker | 78 | 20 | 25.6 |
| Michael Hurley | 59 | 19 | 32.2 |
| Michael Hibberd | 40 | 11 | 27.5 |
| 2013 | |||
| Jake Carlisle | 79 | 21 | 26.6 |
| Cale Hooker | 61 | 18 | 29.5 |
| Michael Hibberd | 41 | 7 | 17.1 |
| Michael Hurley | 10 | 3 | 30 |
4 Likes
Not nice reading for M Redman or M Hurley
1 Like
Suspect it is affected by role.
Appears that players who try and balance the attacking and defensive elements generally score worse than those who play a purely defensive game. Except this year, when there has been enough pressure on the ball carrier up the ground to affect the speed the ball cones in when you’re playing slightly off your man.
I’d that makes sense? I may be reading too much into it 
1 Like
Redman is at least slightly improving. (interesting that Gleeson has consistently got him well covered in this area)
Hurley had that one very good year…
1 Like
I think Redman’s just not that good in one on ones, and Hurley has lost that in his game.
Unless you are Nick Hind, it seems.
But yes, agree on your overall point. Different systems, different defensive roles, different players up the ground… all play a part.
1 Like
Hurley was an absolute gun pre 2016, hardly ever lost a contest. Suspect the ask to play more offensively and also the shoulders and wrist challenges hurt him.
Love those stats though, shows just how good Ridley and Hind are
1 Like
My takeaway from those numbers is that our defensive structures including the pressure up the ground is working this season given we are losing a much lower percentage of one on ones.
1 Like
I explicitly highlighted this year, as both Hind and Ridley’s numbers are great, even though they can both be offensive weapons.
My (admittedly dodgy) theory is that players who might get off their man a bit were caught out of position in previous years and stuck is poor one on ones, whereas this year they had more opportunity to compete on the one on ones.
Another theory might be that the defence is working better to cover for each other and not leave someone desperately trying to get back to cover a loose man (and hence be in a disadvantaged one on one)
The overall theory being you’ll lose more one on ones if your opponent receives the ball to advantage, whereas if it’s coming in less targetted you’re a much better chance to at least halve the contest, so upfield pressure affects the numbers without the players being any better or worse themselves.
1 Like
Yeah, I realised just after I posted that I had misread your next bit…
I agree with what you are saying. I’m still trying to find an expanded definition on the stat and what they specifically count as a contested one on one.
But I do find it interesting that the numbers (for the most part, a few surprises) match up to what the general ‘feeling’ was, or what the eye saw, in regards to how guys were going one on one. (E.G. Ambrose was almost unbeatable in 2019, Hurley’s 2015 % v his 2017 %, Mason Redman struggling in one on ones, etc.)
I’d love to see Fletchers numbers. Maybe not for 1993, but certainly the latter part of the career.
1 Like
Something else to consider with Ridley and Hind is we want those players to be able to leave there direct opponents to intercept (Ridley) or rebound (Hind) so they are often on less dangerous opposition then players like Hurley, Francis, Stewart and Laverde. Obviously Ridley and Hind dont always play on bad players but they often play on someone who they would be expected to beat one on one.
2 Likes
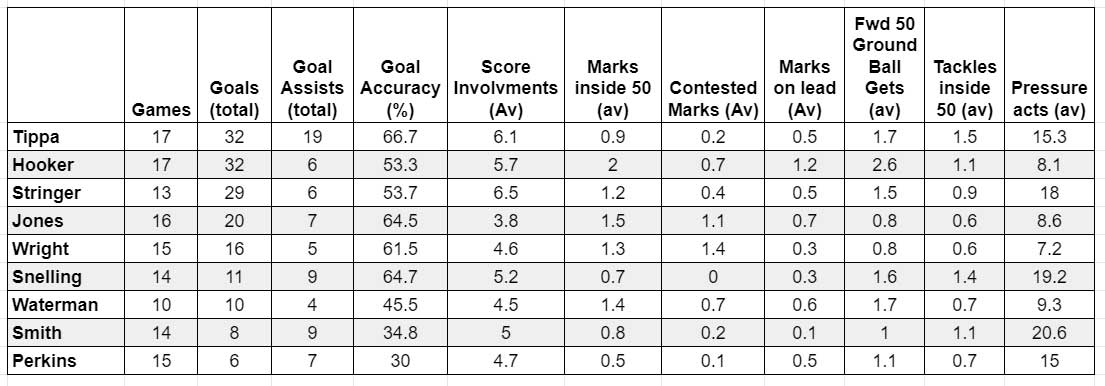
Oh, and one more. (I’ll have to jpeg this, as it’s too wide to fit as a blitz table.)
I chucked together some stats about how our forward line was performing. I’ll probably get to the other lines, but I started here.
4 Likes
It’s an interesting point. But, if you look back, the better % scores over the years were by players who were playing pure lockdown roles on the better players, while the guys who rebounded or intercepted struggled a bit more in one on ones.
It’s hard to say either way. It’s not a stat that makes any definitive conclusions, but I find it a useful guide to look at.
Weird looking at that that Cale is in the gun
Is it just because he’s over 30?
1 Like
Watching Redmond play, I wonder whether he wouldn’t be more effective on the wing or even in the midfield. While the club is doing some experimenting with players, why not try him and experiment. He and Hind are more versatile than other than sole defenders.
I know, right?
I hope its not afl fantasy points. because those things aren’t accurate IMO in terms of predicting BOG. usually the better players yes.
What I take out of those defensive stats is that Tom Cutler is our best one-on-one defender.
1 Like
I’d like to know how many times he brings the ball to ground compared to other key forwards and how many aerial contests he creates (i.e. in a position to spoil if caught behind not 2 meters behind the interceptor).
2 Likes