Is that really playing to his strengths though? I reckon wing is his position for the foreseeable future
Maybe a Tom Lynch (Crows) style high roaming forward? I do love the mismatch that we get on the wing though.
What I would love to see is us setting up at kick outs so that he’s taking the opposition wingman out onto the less congested wing. Should be able to out mark 90% of his opponents within a year or two.
Yeah I’m thinking wing until 2023… then we see. If he can build the fitness base to cover 15+kms a game he’s going to be a weapon regardless of where he ends up. I expect those shoulders to fill out, he’s already wiry strong. Could end up like a modern day Koutafides (fark carlton I know).
The data that Richard Little has been posting has been great, even if I have to squint like crazy to actually make sense of it.
The take away is that we’re a great side at scoring for clearances and a middling to poor one to scoring from turnovers. I think the turnover game is probably regarded as more sustainable long term, but I also think we’ve improved in that area in the back half of the season.
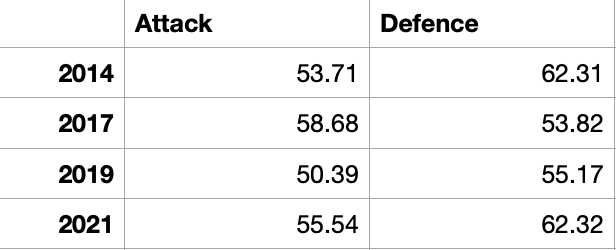
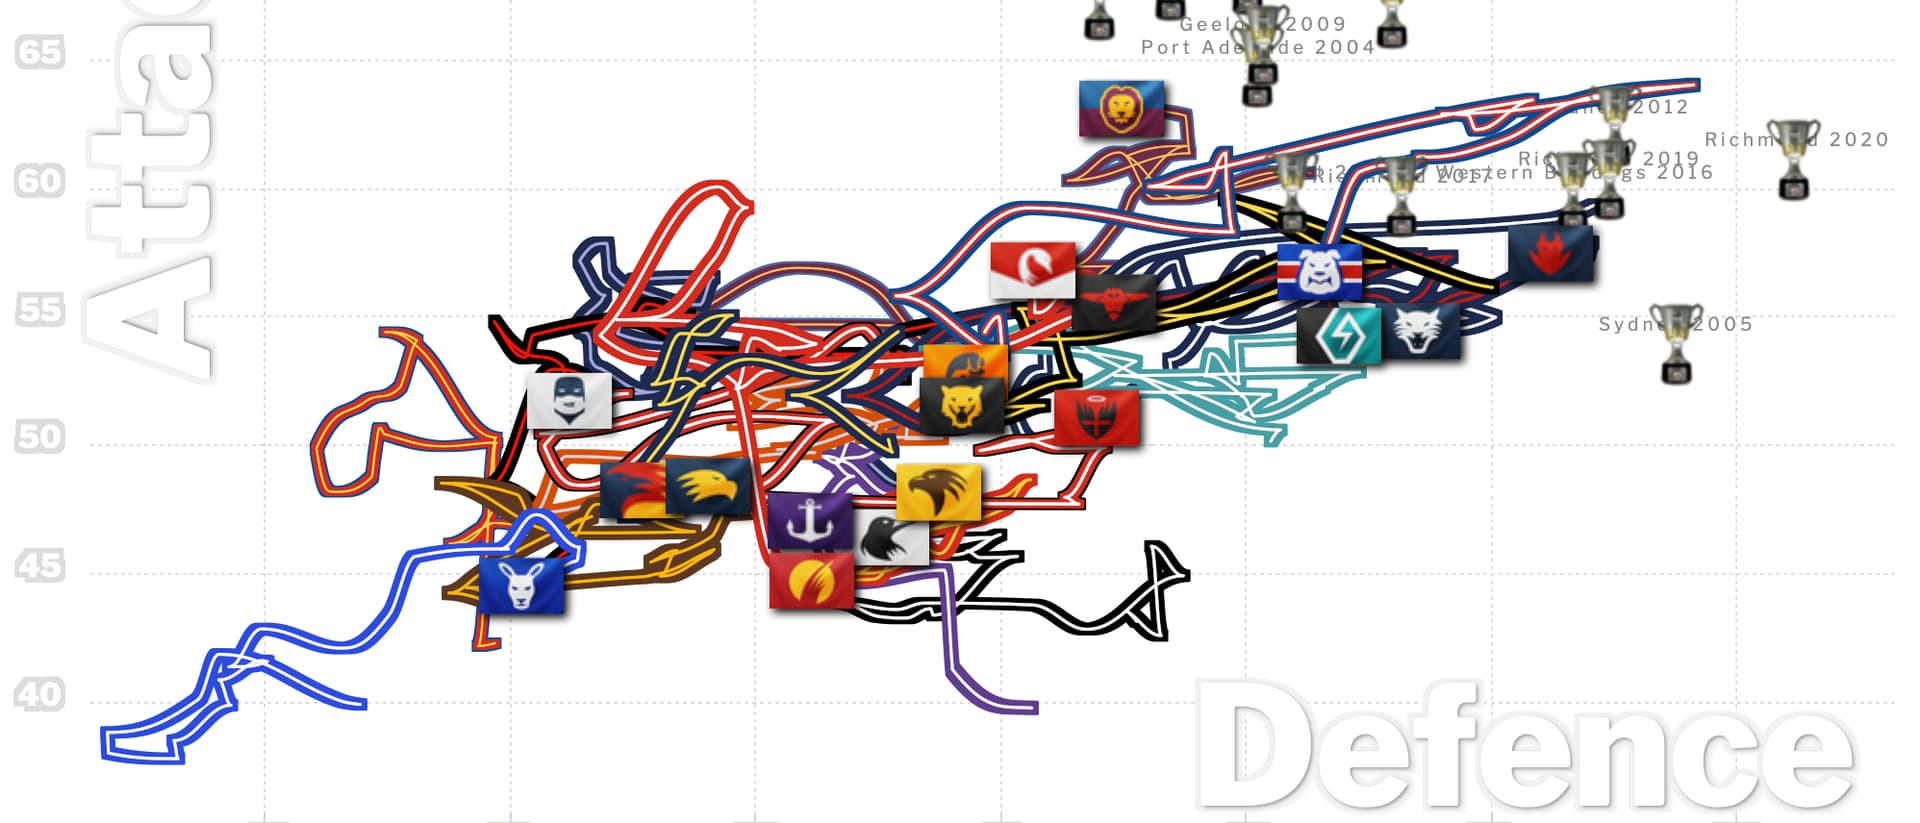
I began this thread a million years ago with data from the Squiggle and other stats blogs, so I thought it might be fun to see how we stack up at the end of this H&A Season compared to our previous runs at the finals. I’ll post our attack and defence data and a little commentary.
Alright, the good news is that this is the best team we’ve taken into the finals in some time. It is a better defensive outfit than even the slow and steady Bombers of 2014, and our second best attacking unit to the run and gun 2017 model. The other intangible is that, unlike say 2014, our trajectory has been on the up for the entire season.
The bad news is that we’re up against a side that still absolutely has the profile of a premiership contender. There isn’t a single statistical model that has us coming out ahead, but with a number of them it is an incredibly close run thing.
A spanner in the works of the models might be, however, that most of them weight quite favourably to a home team - which on paper is the Bulldogs. But I suspect the noise of affirmation might just be on our side this weekend…
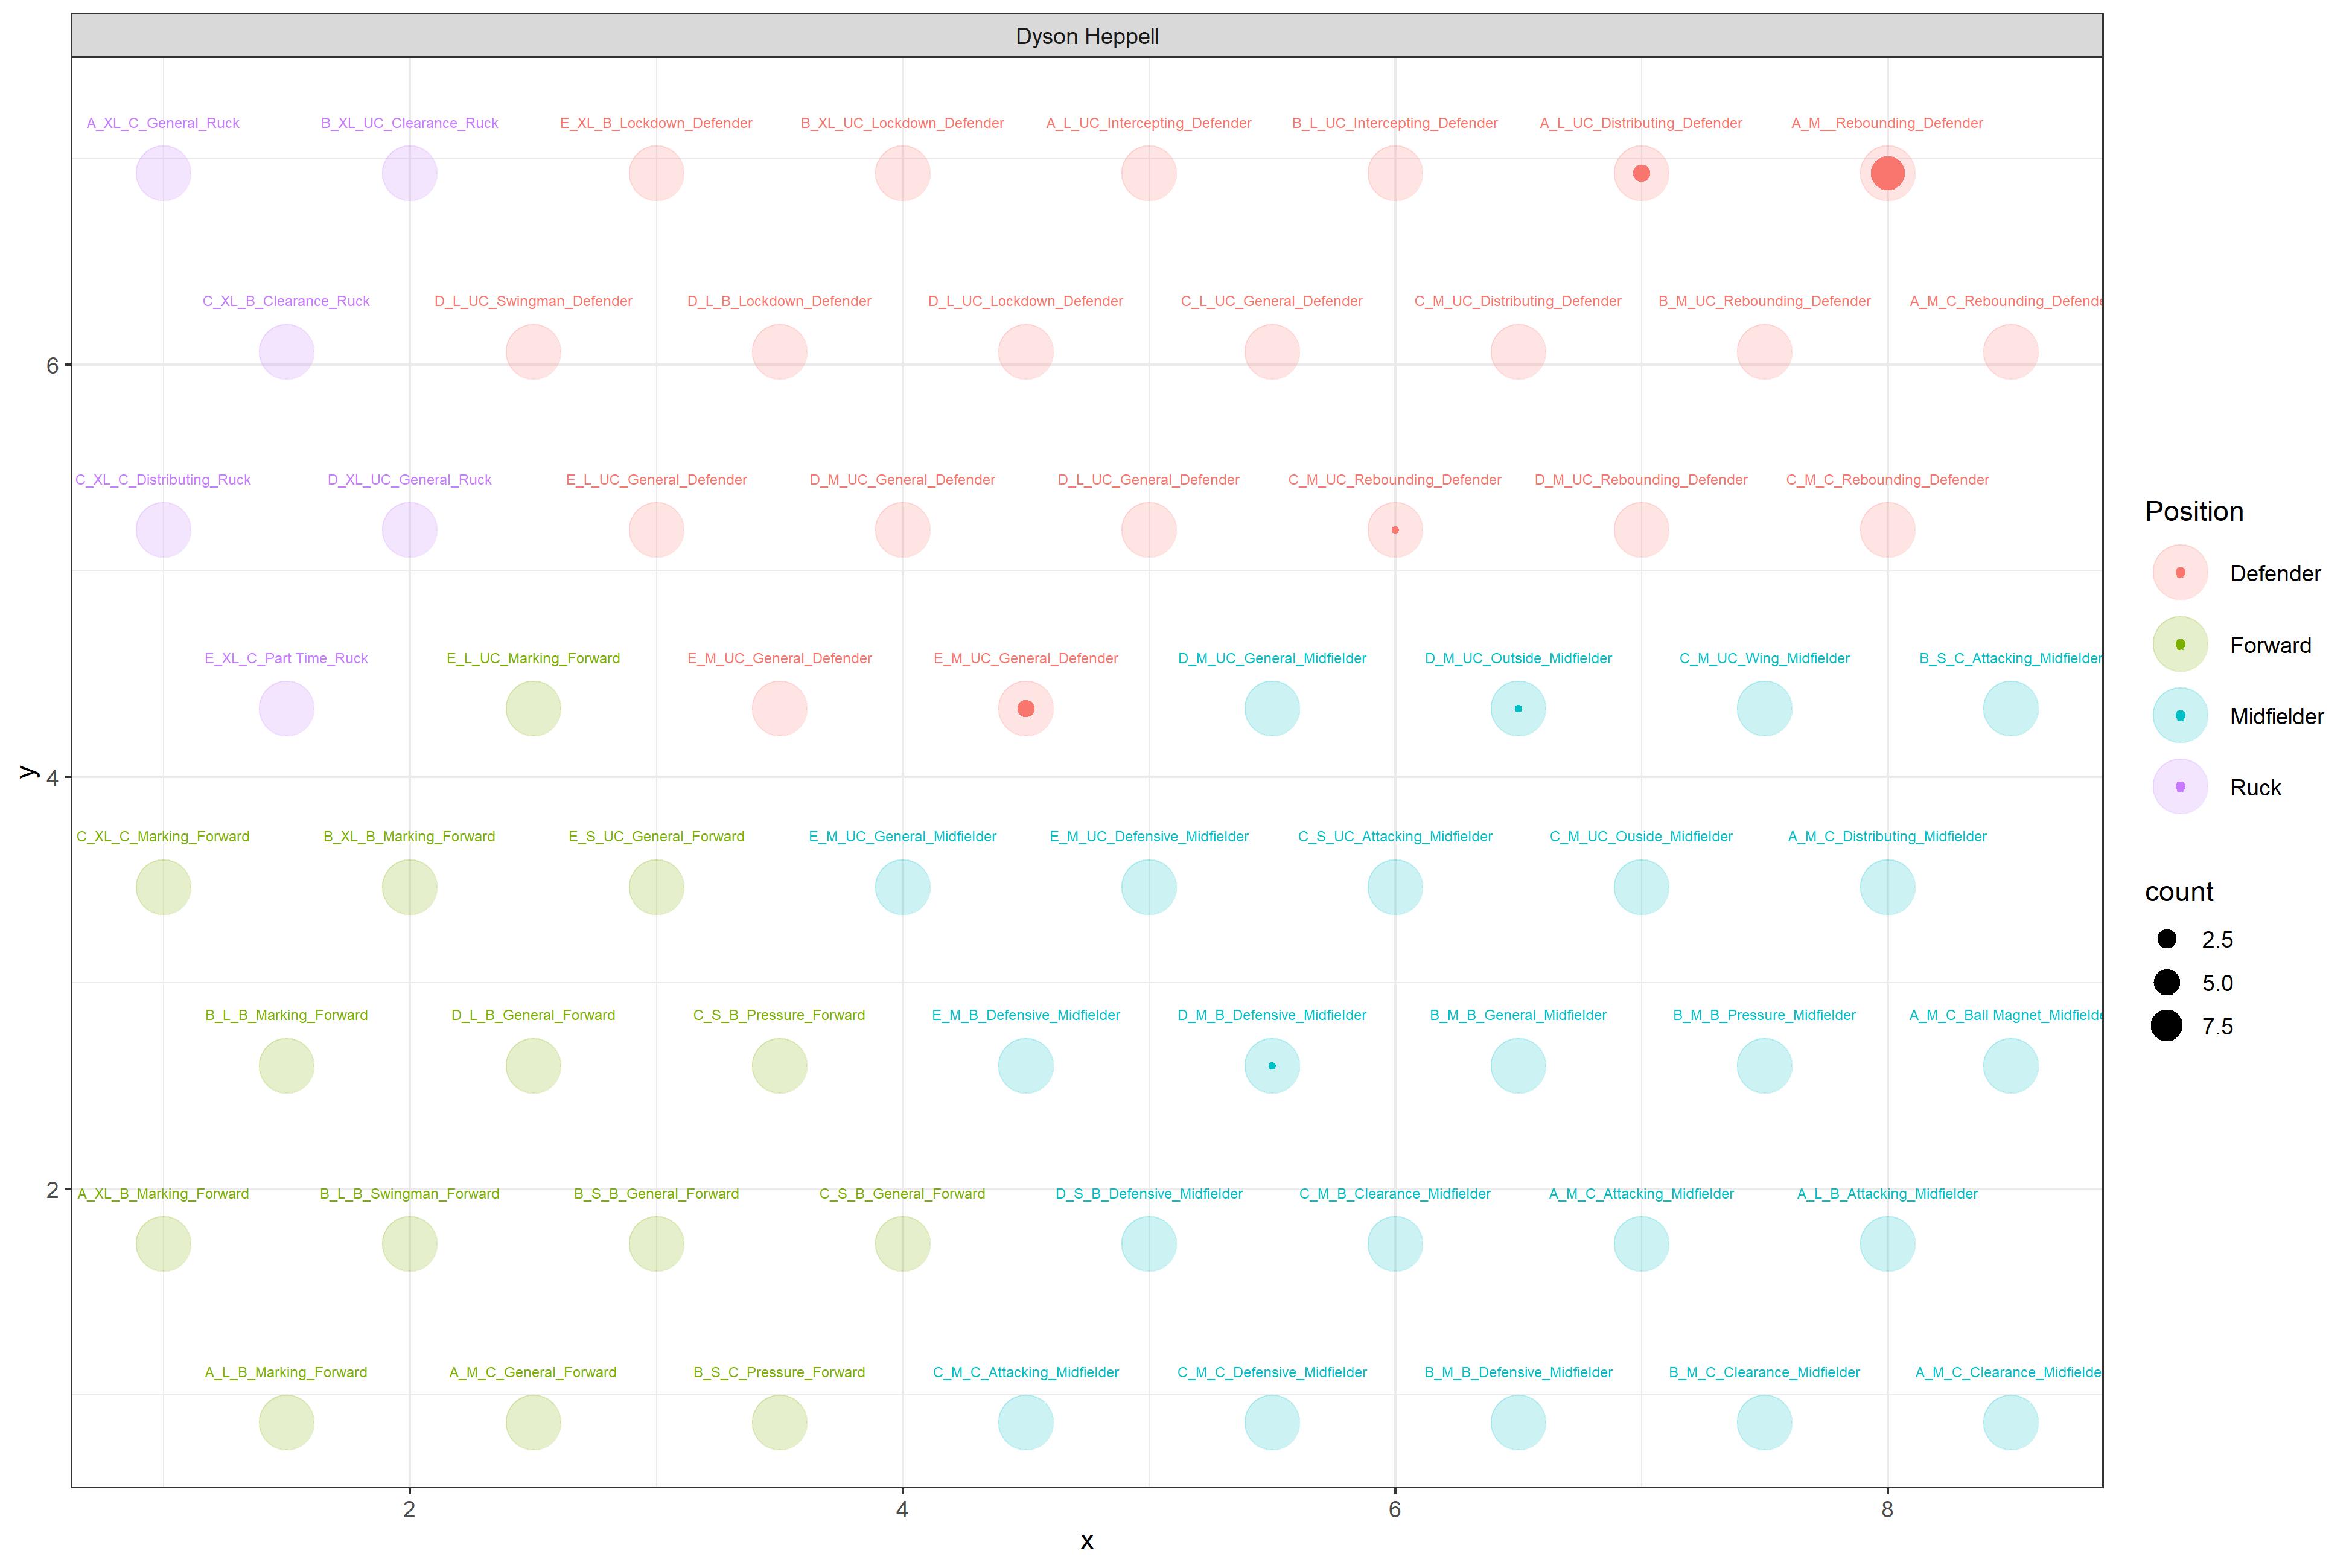
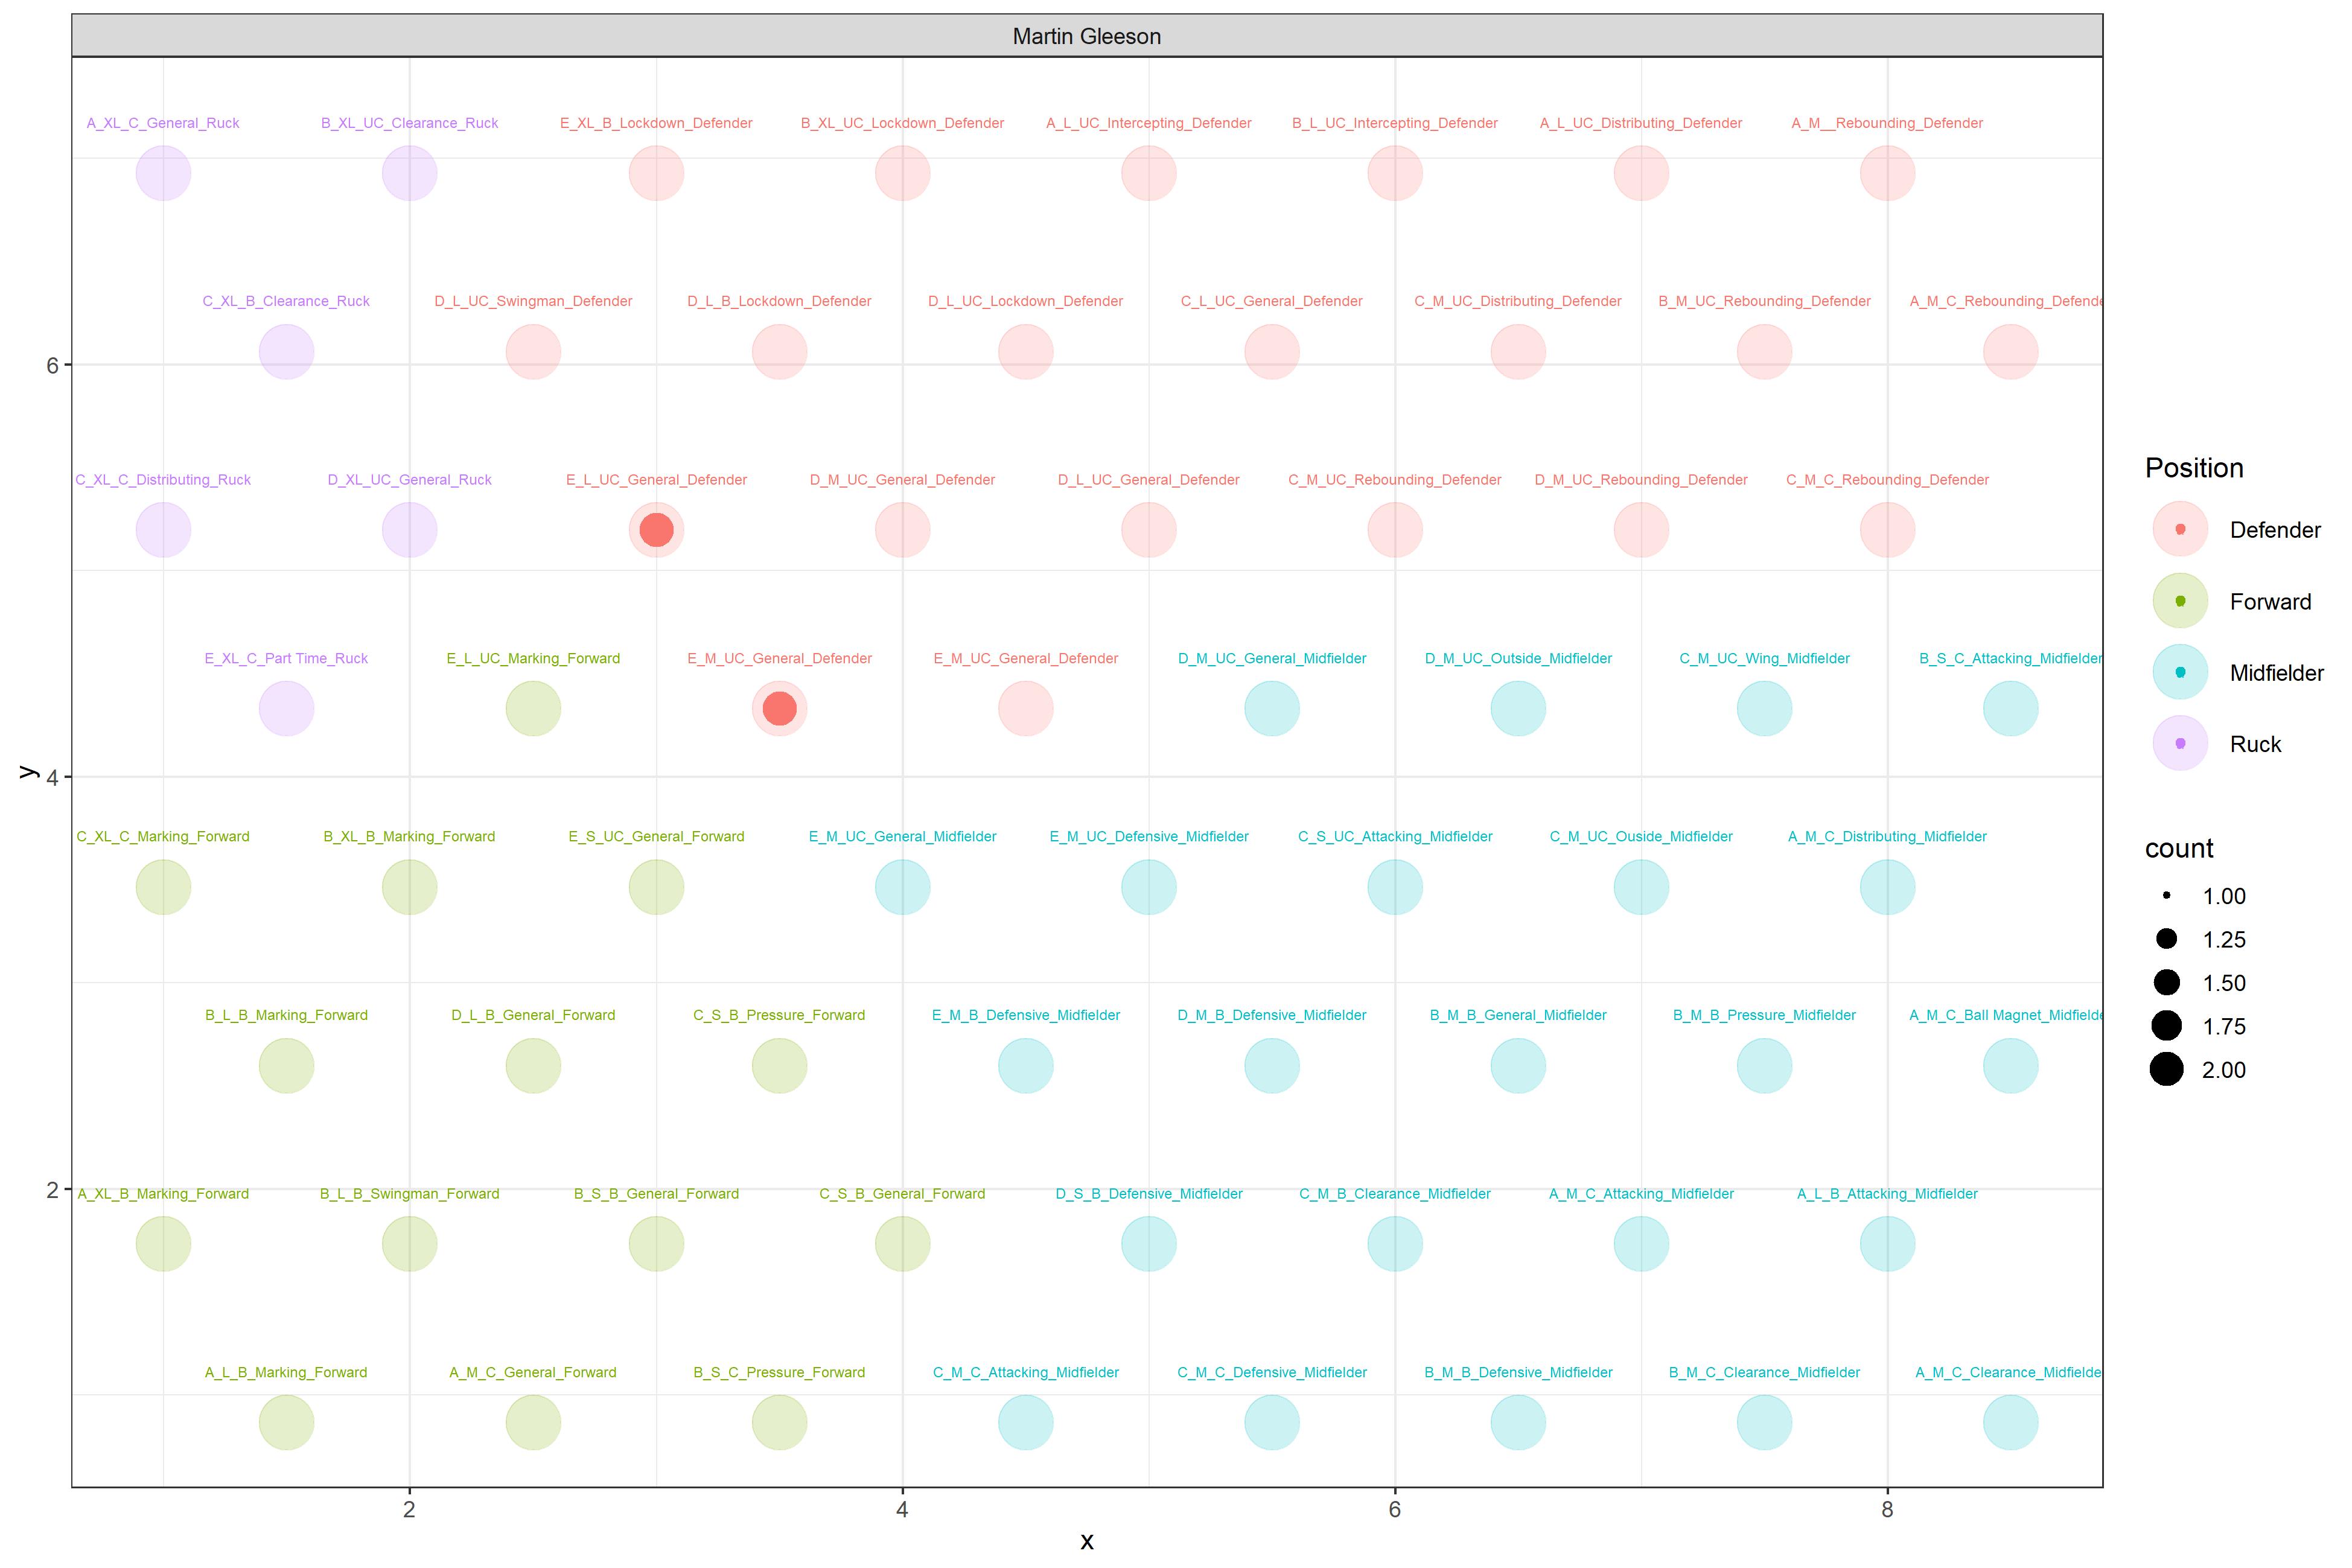
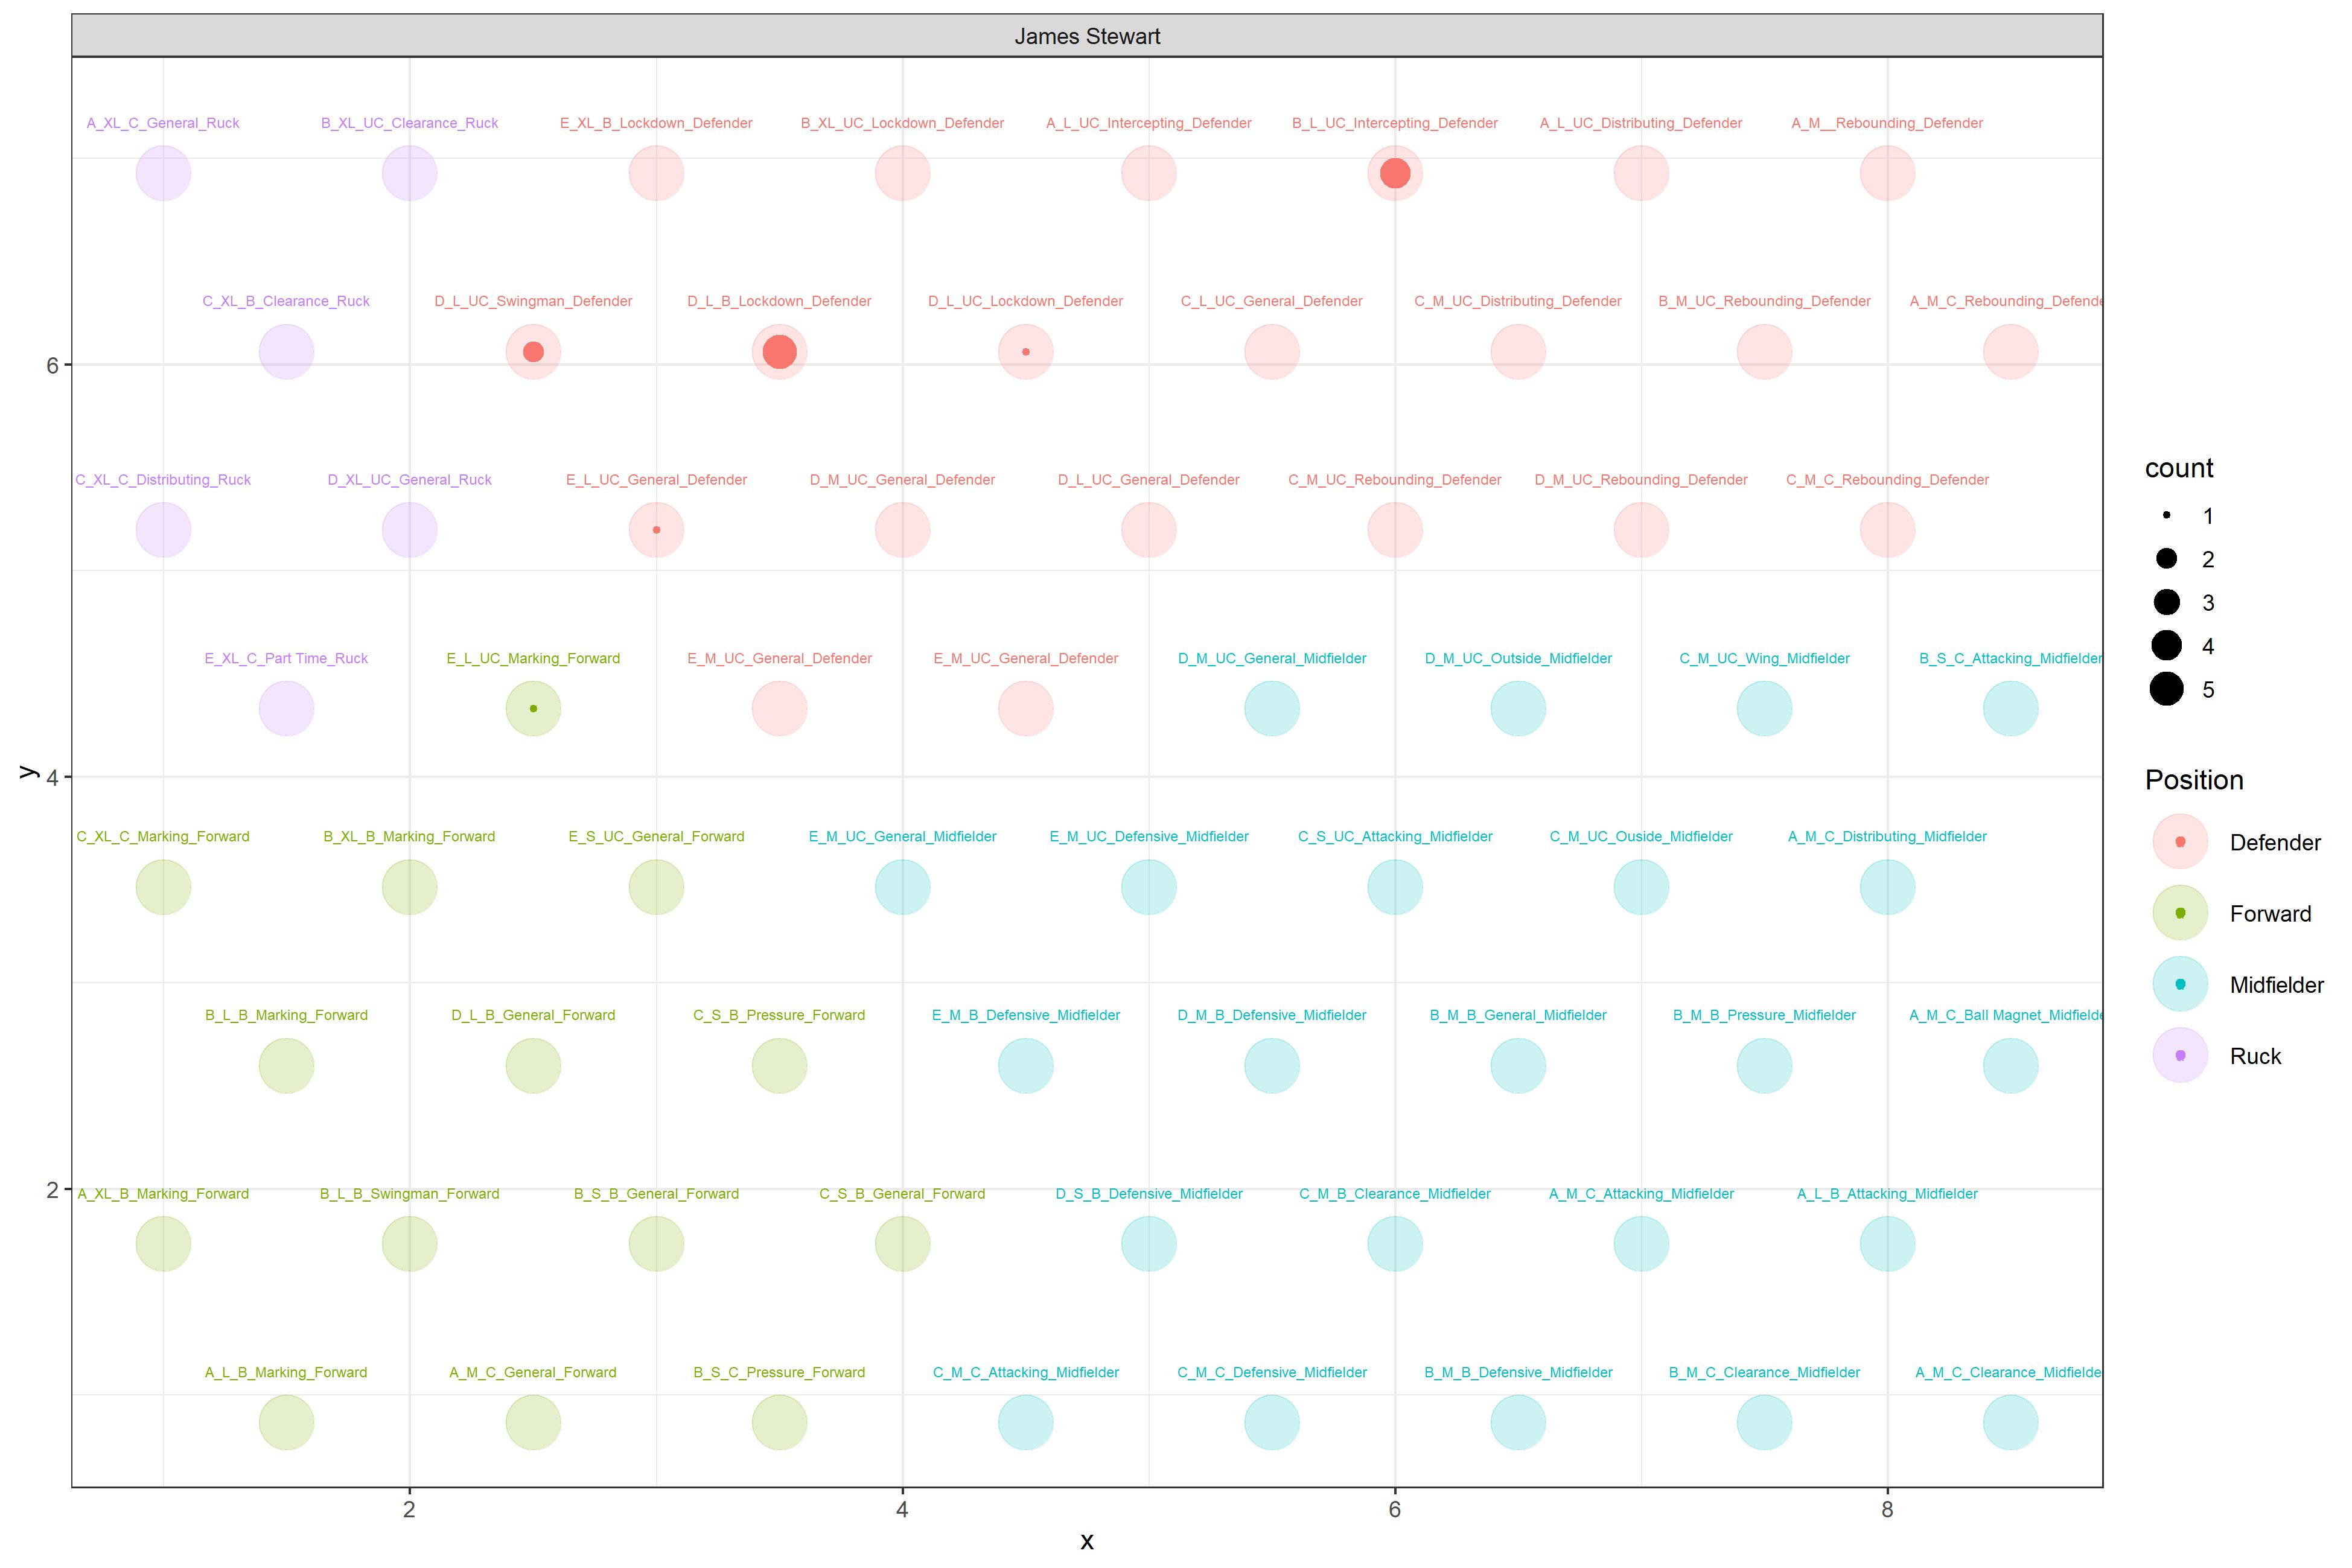
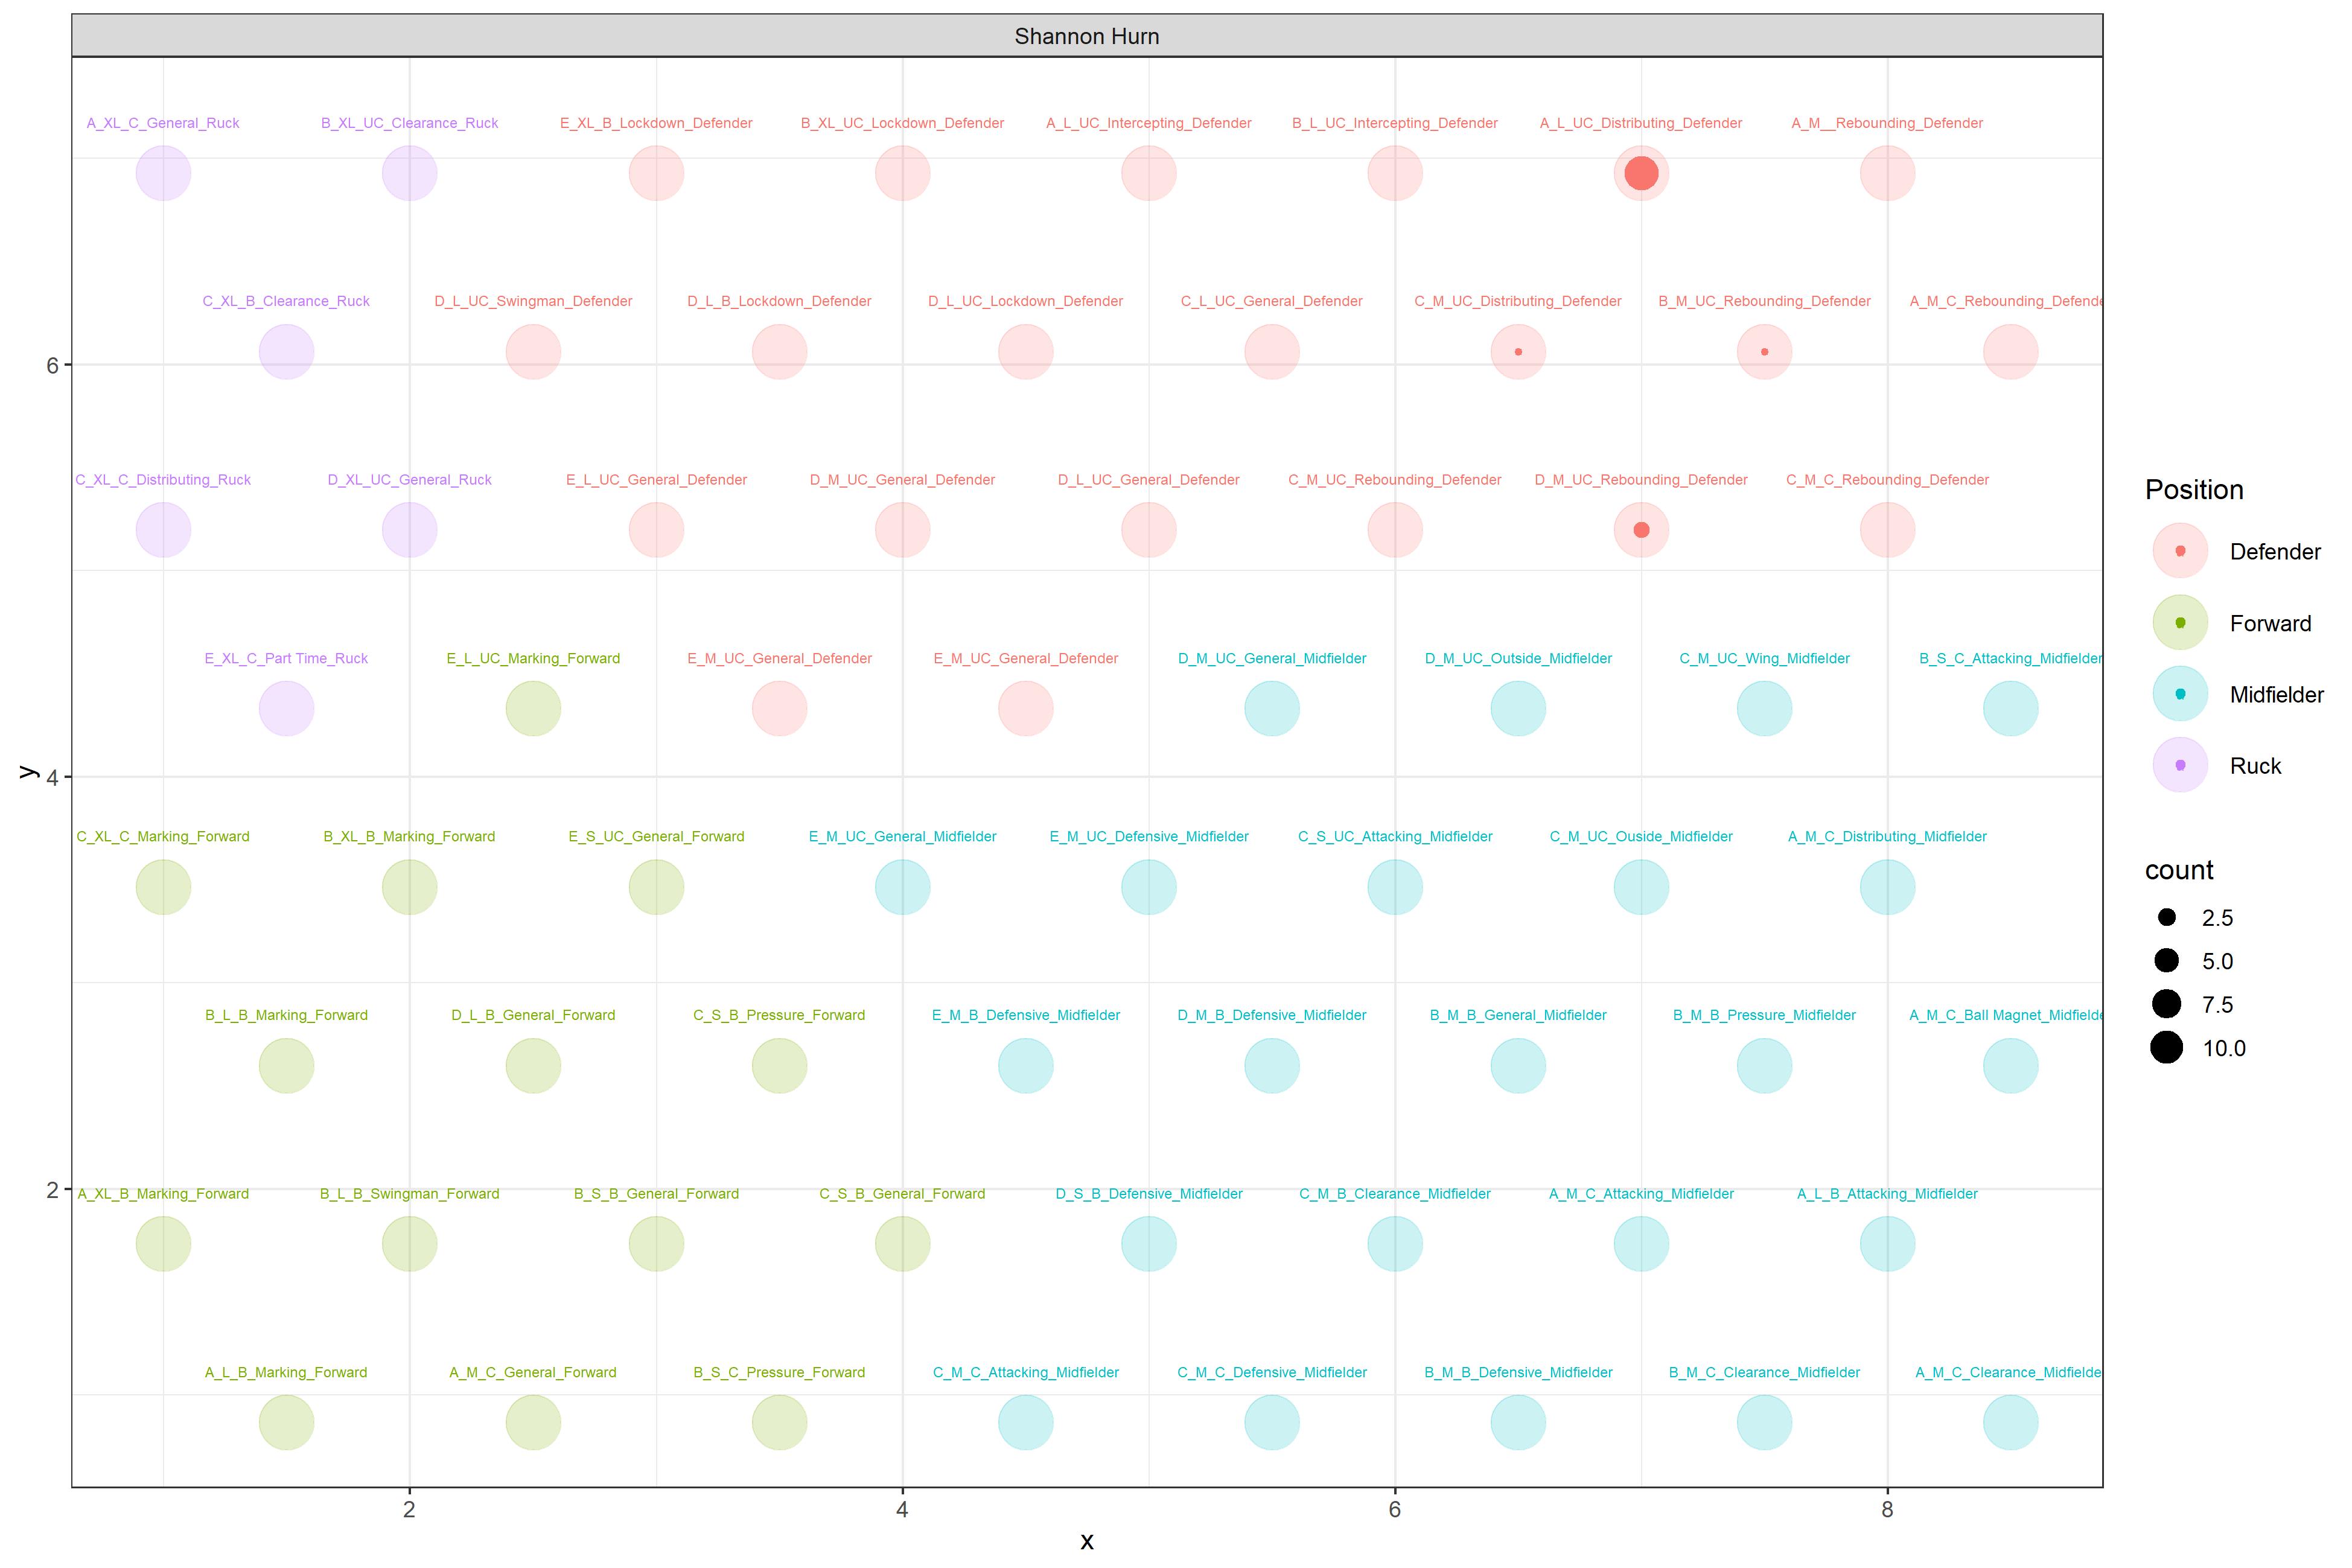
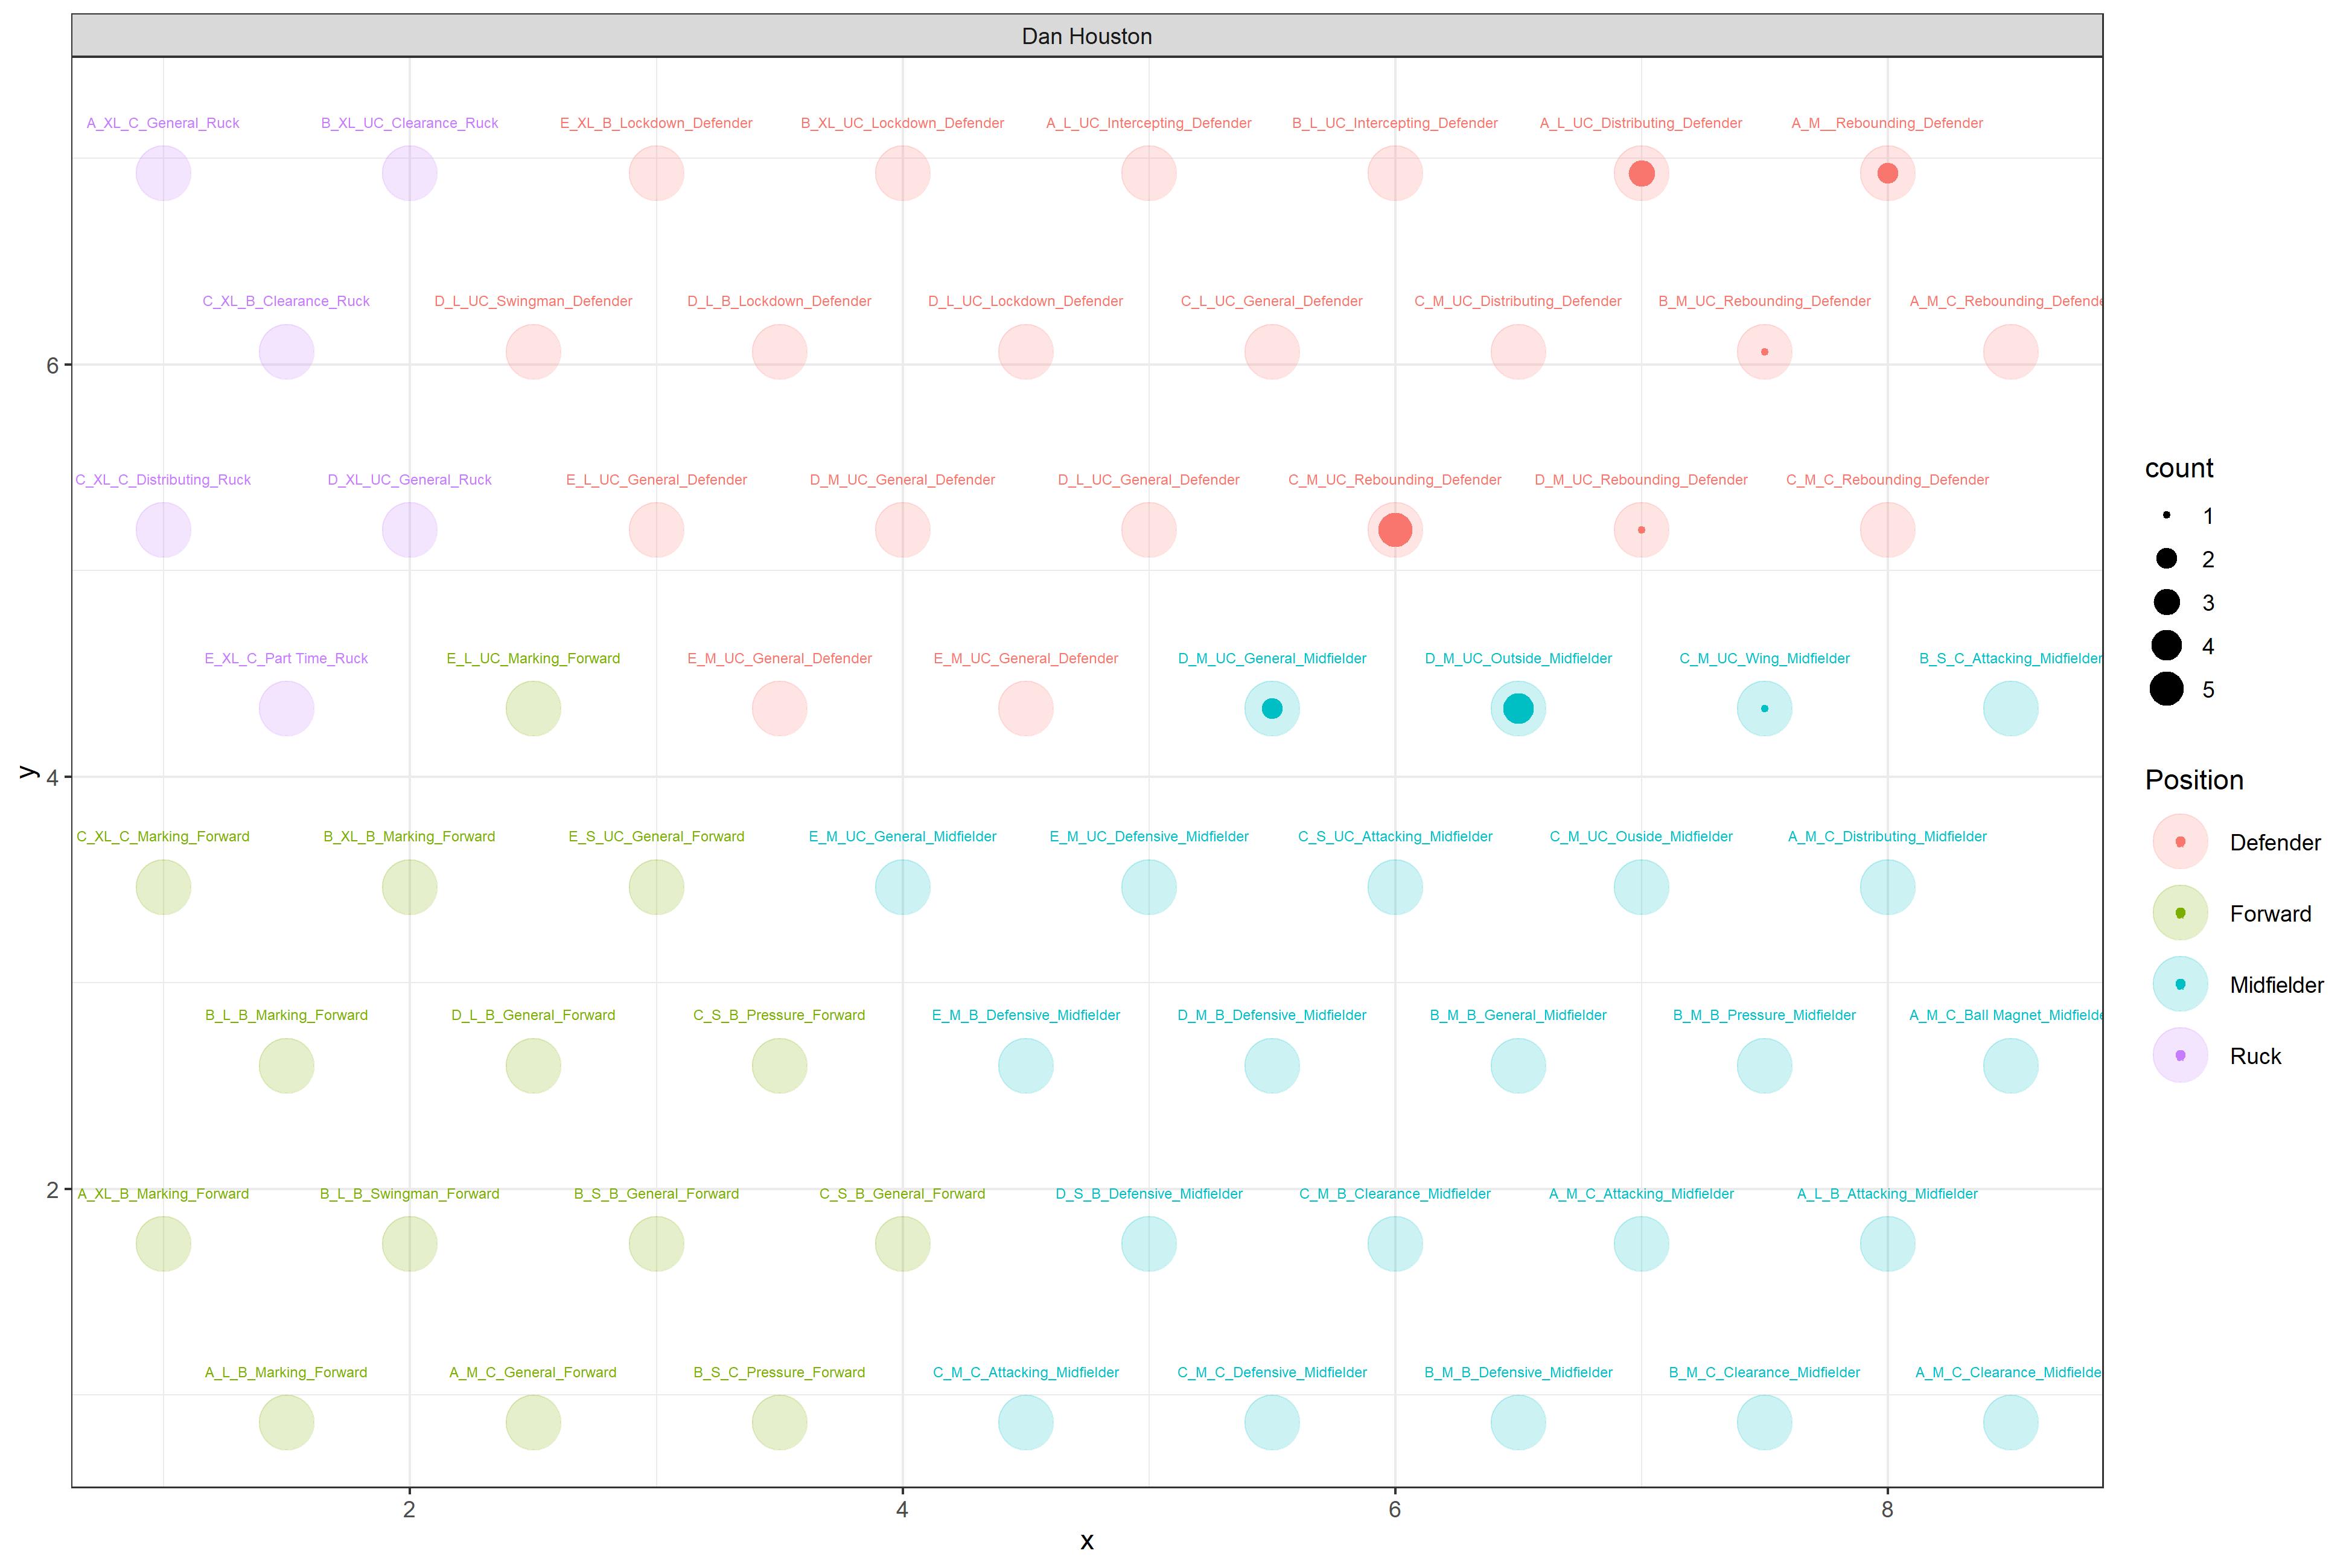
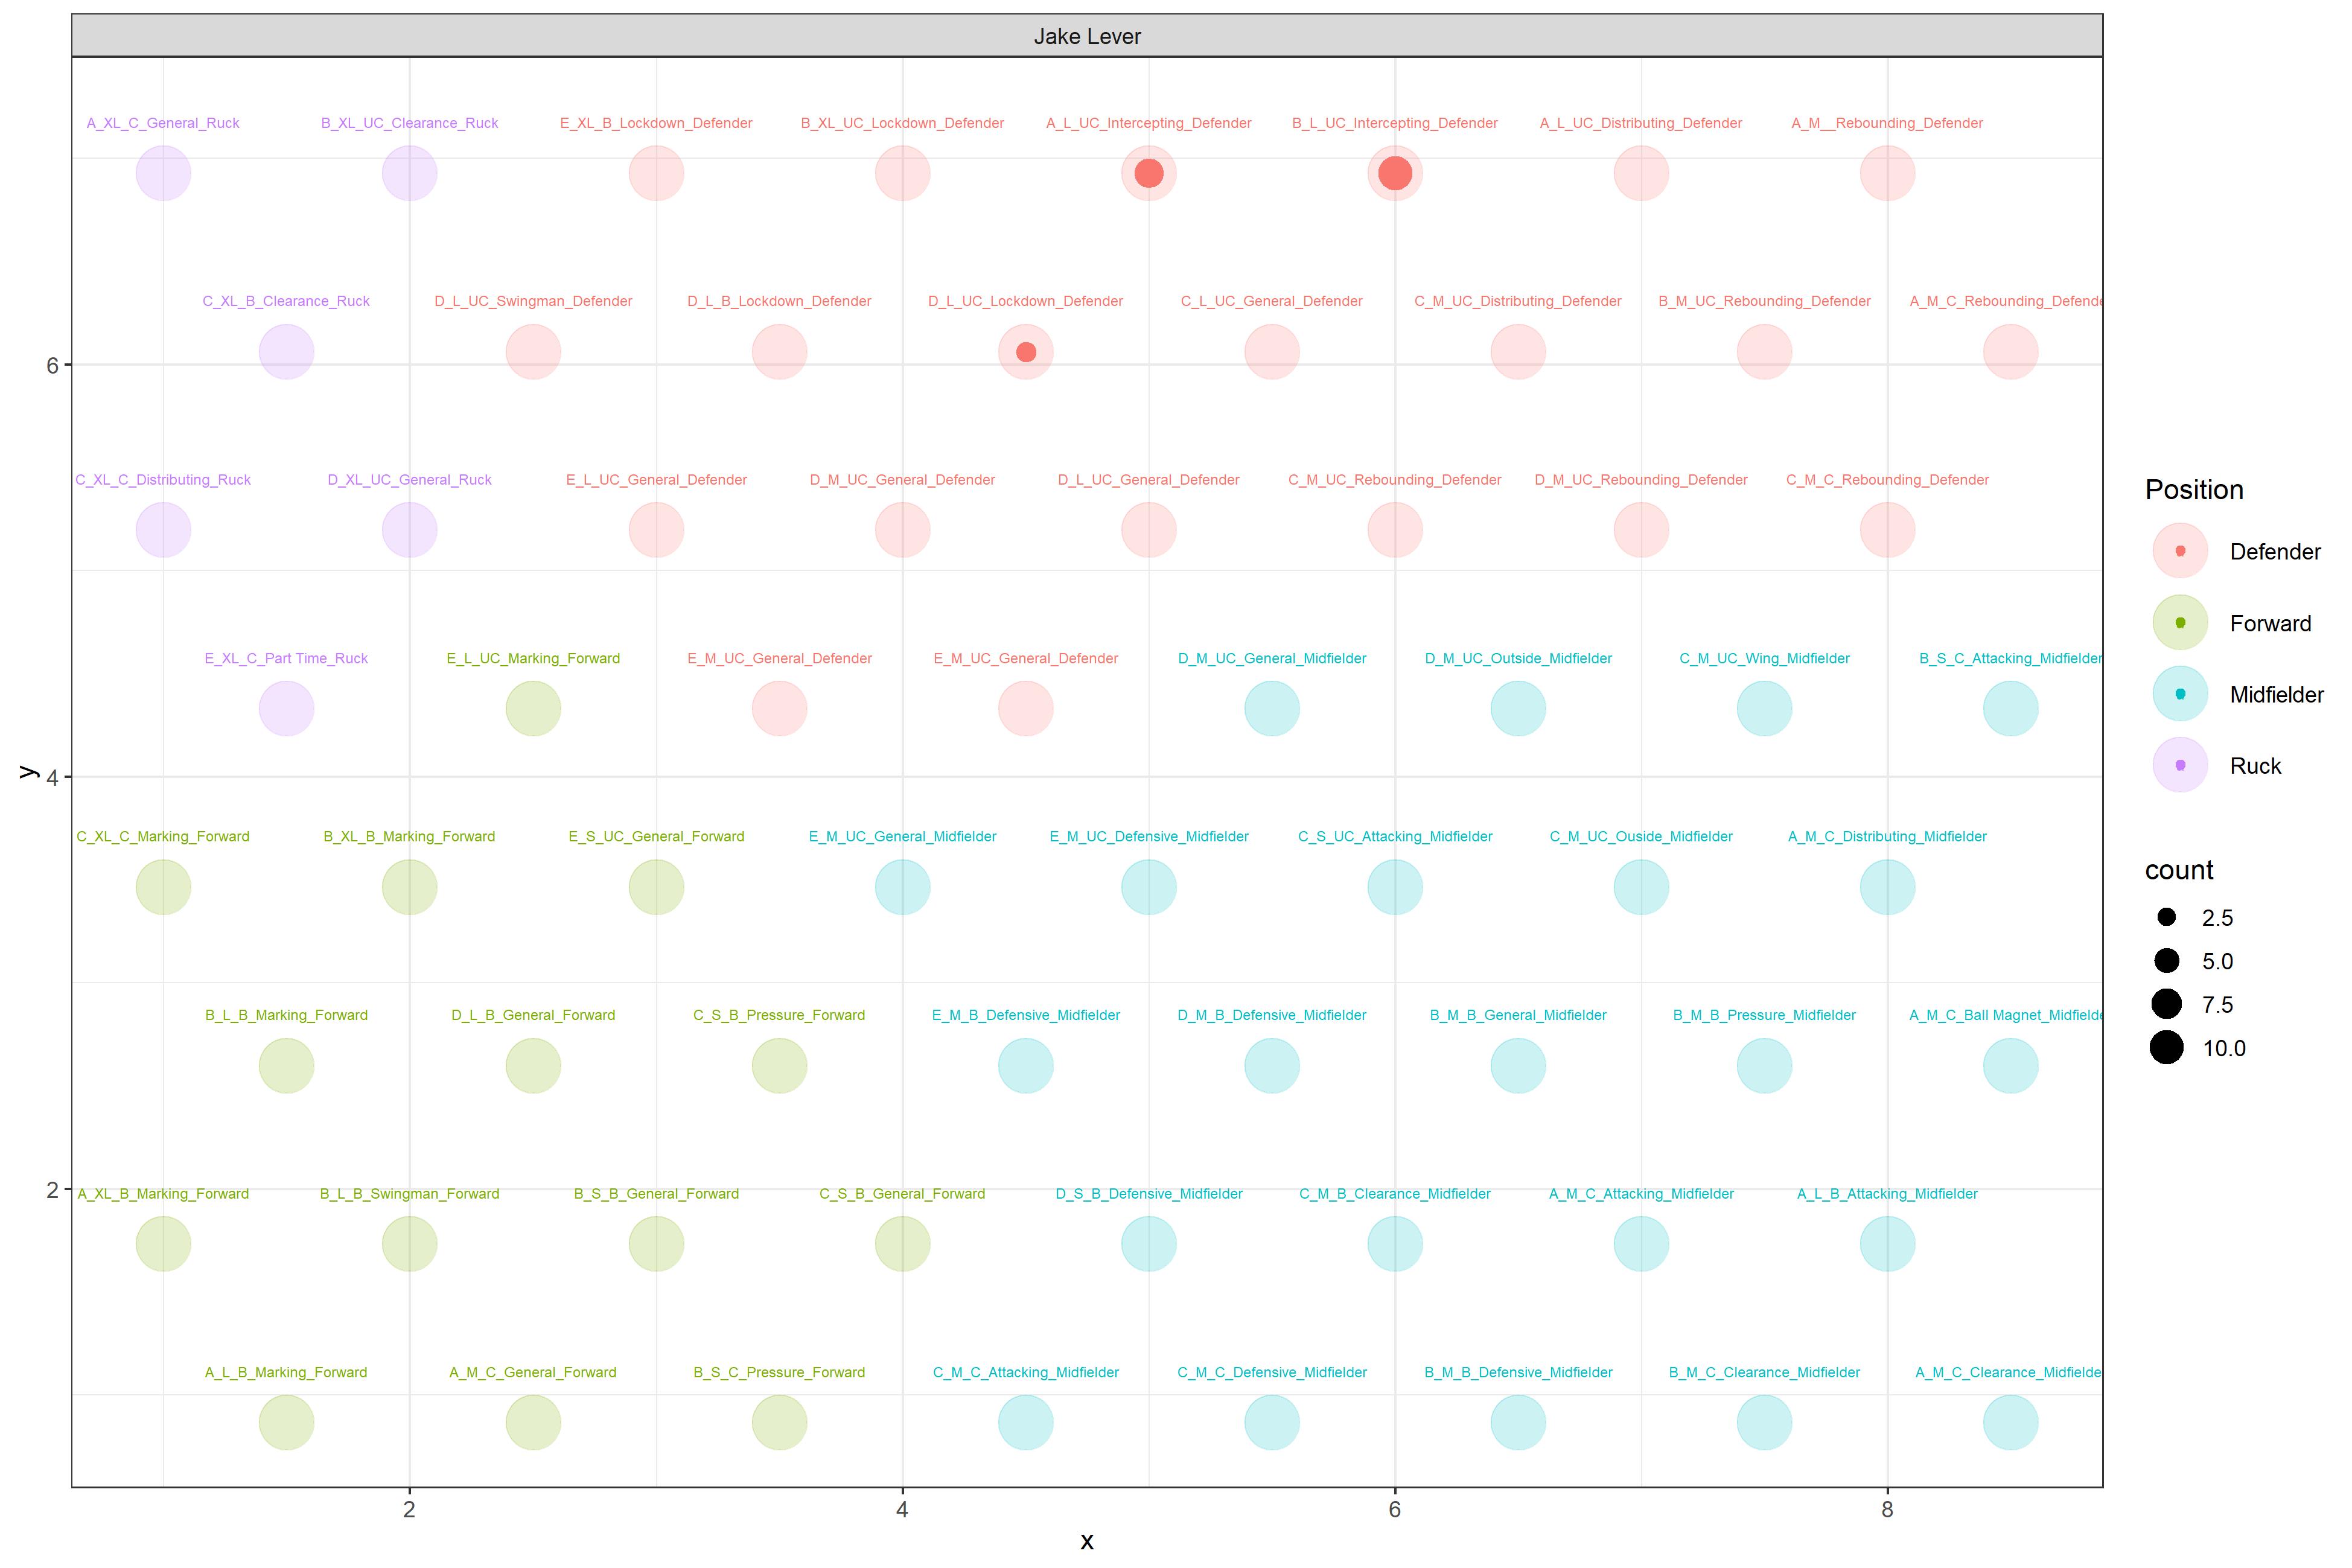
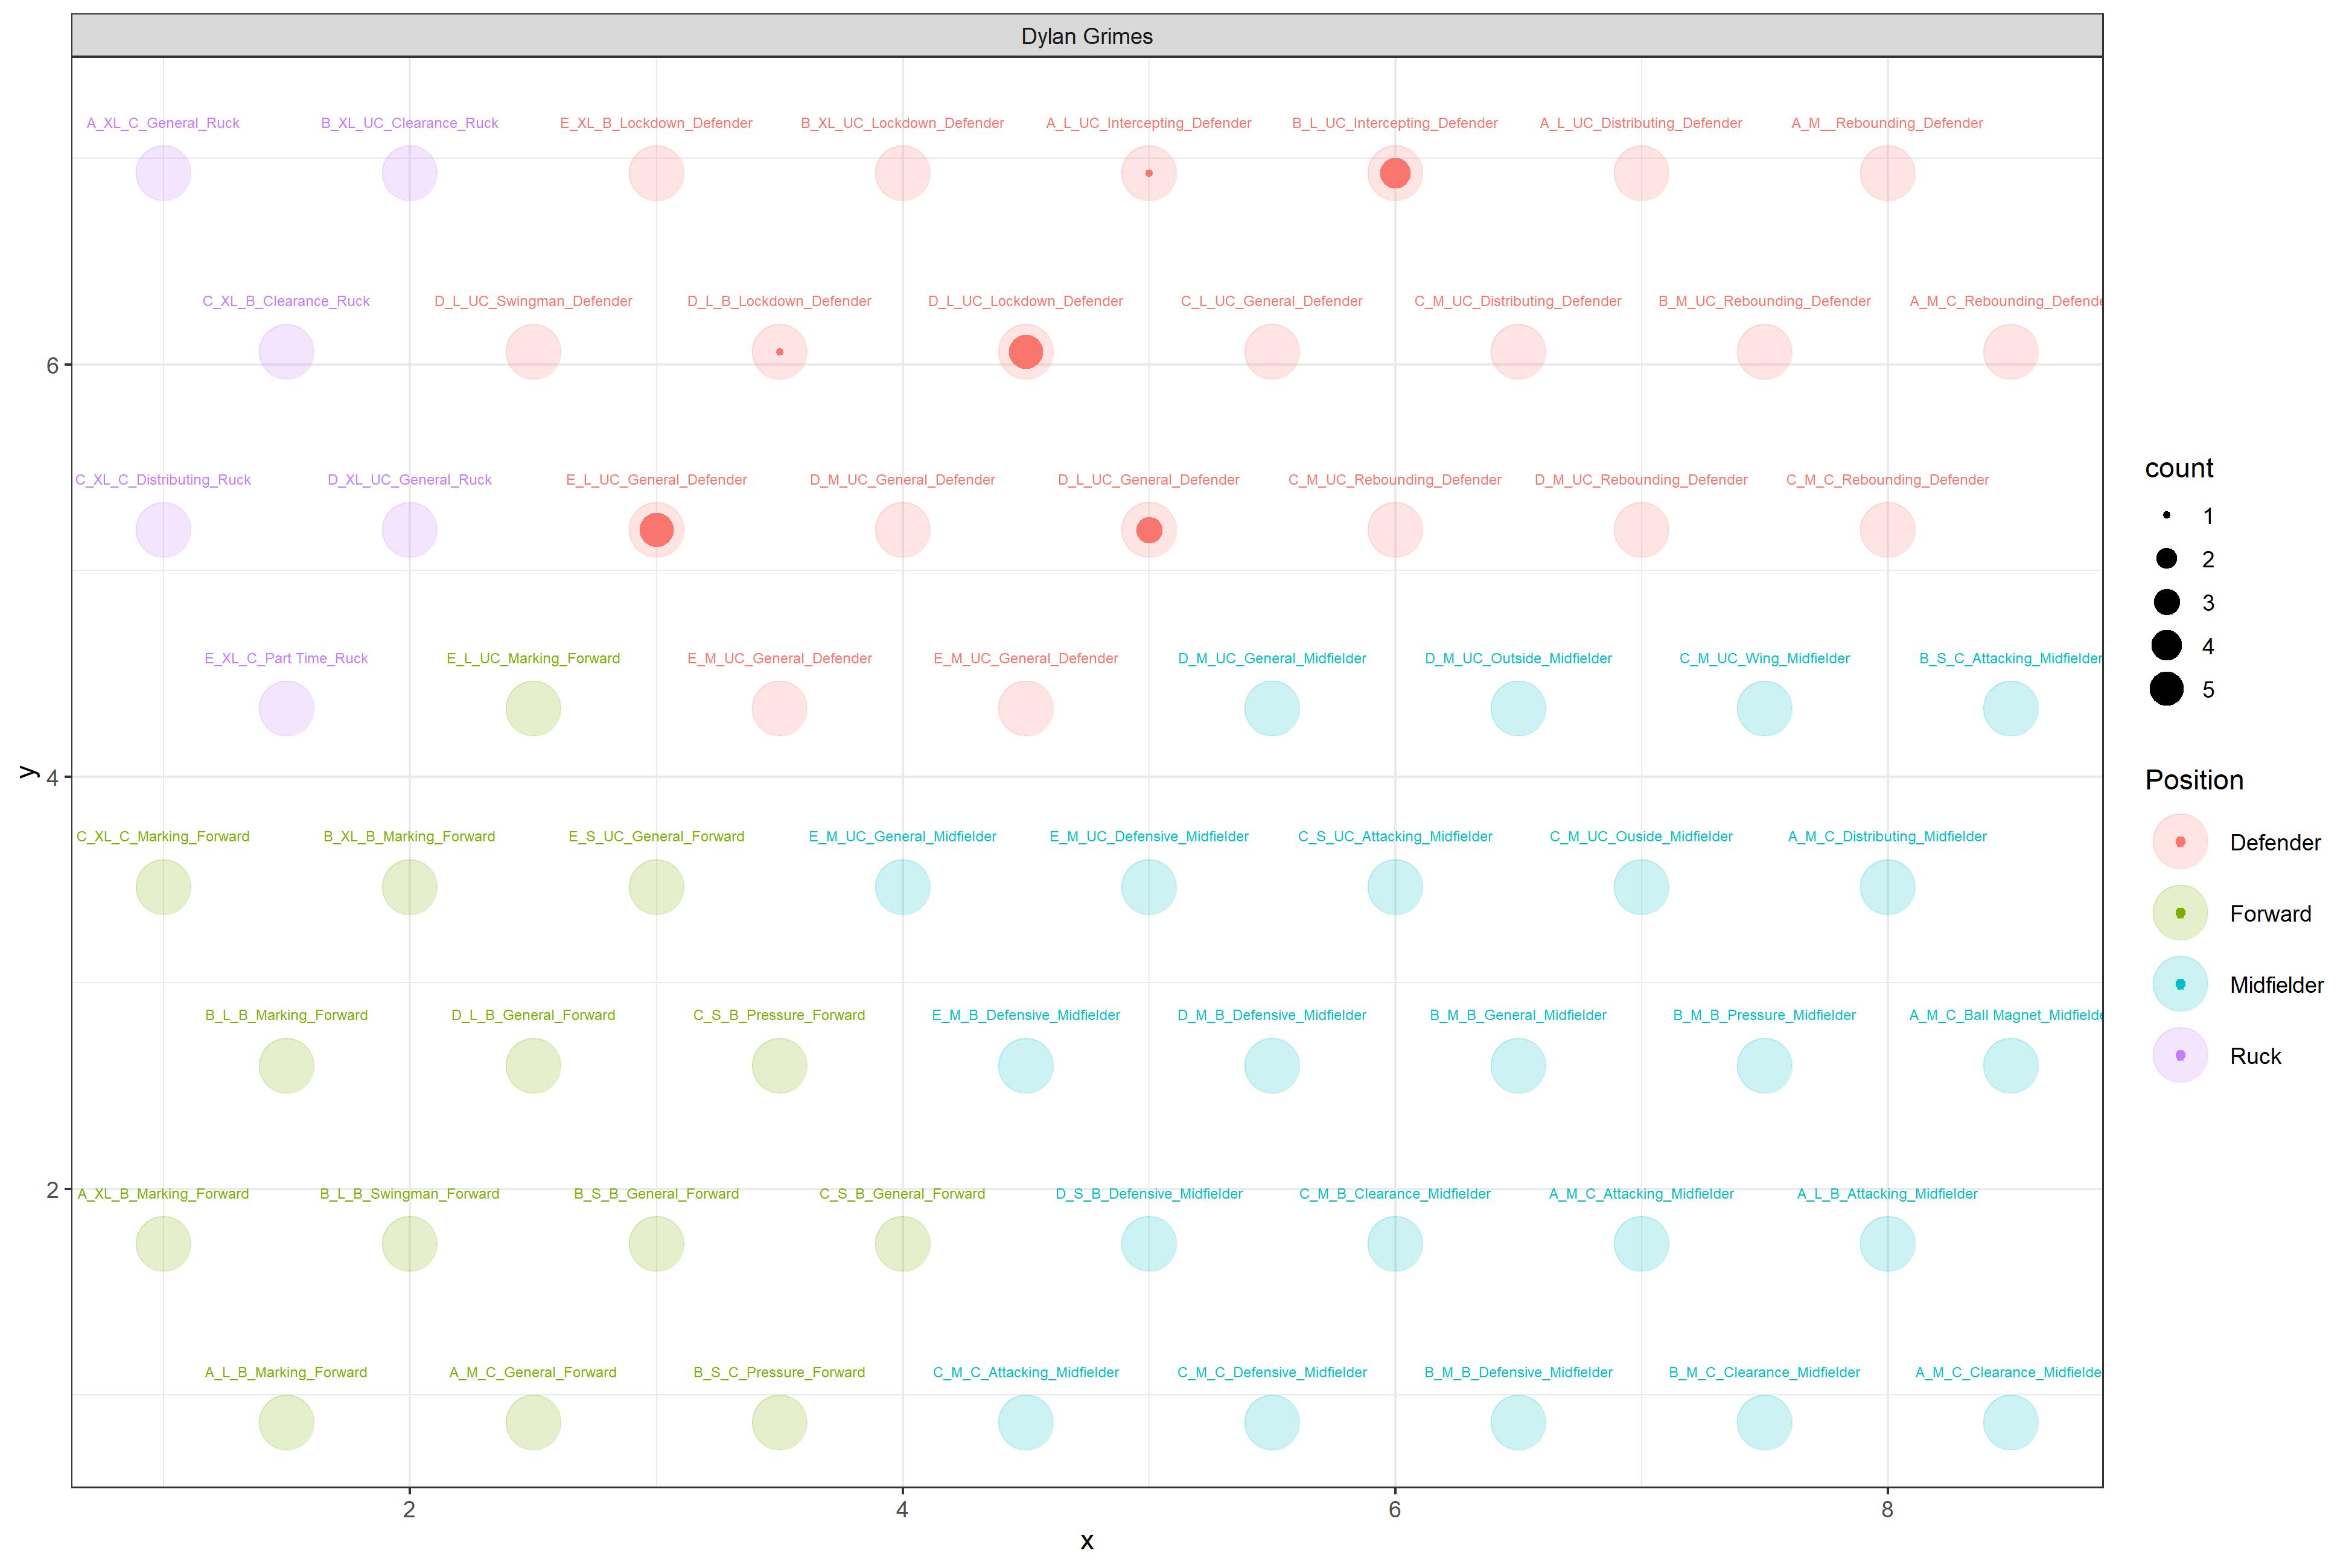
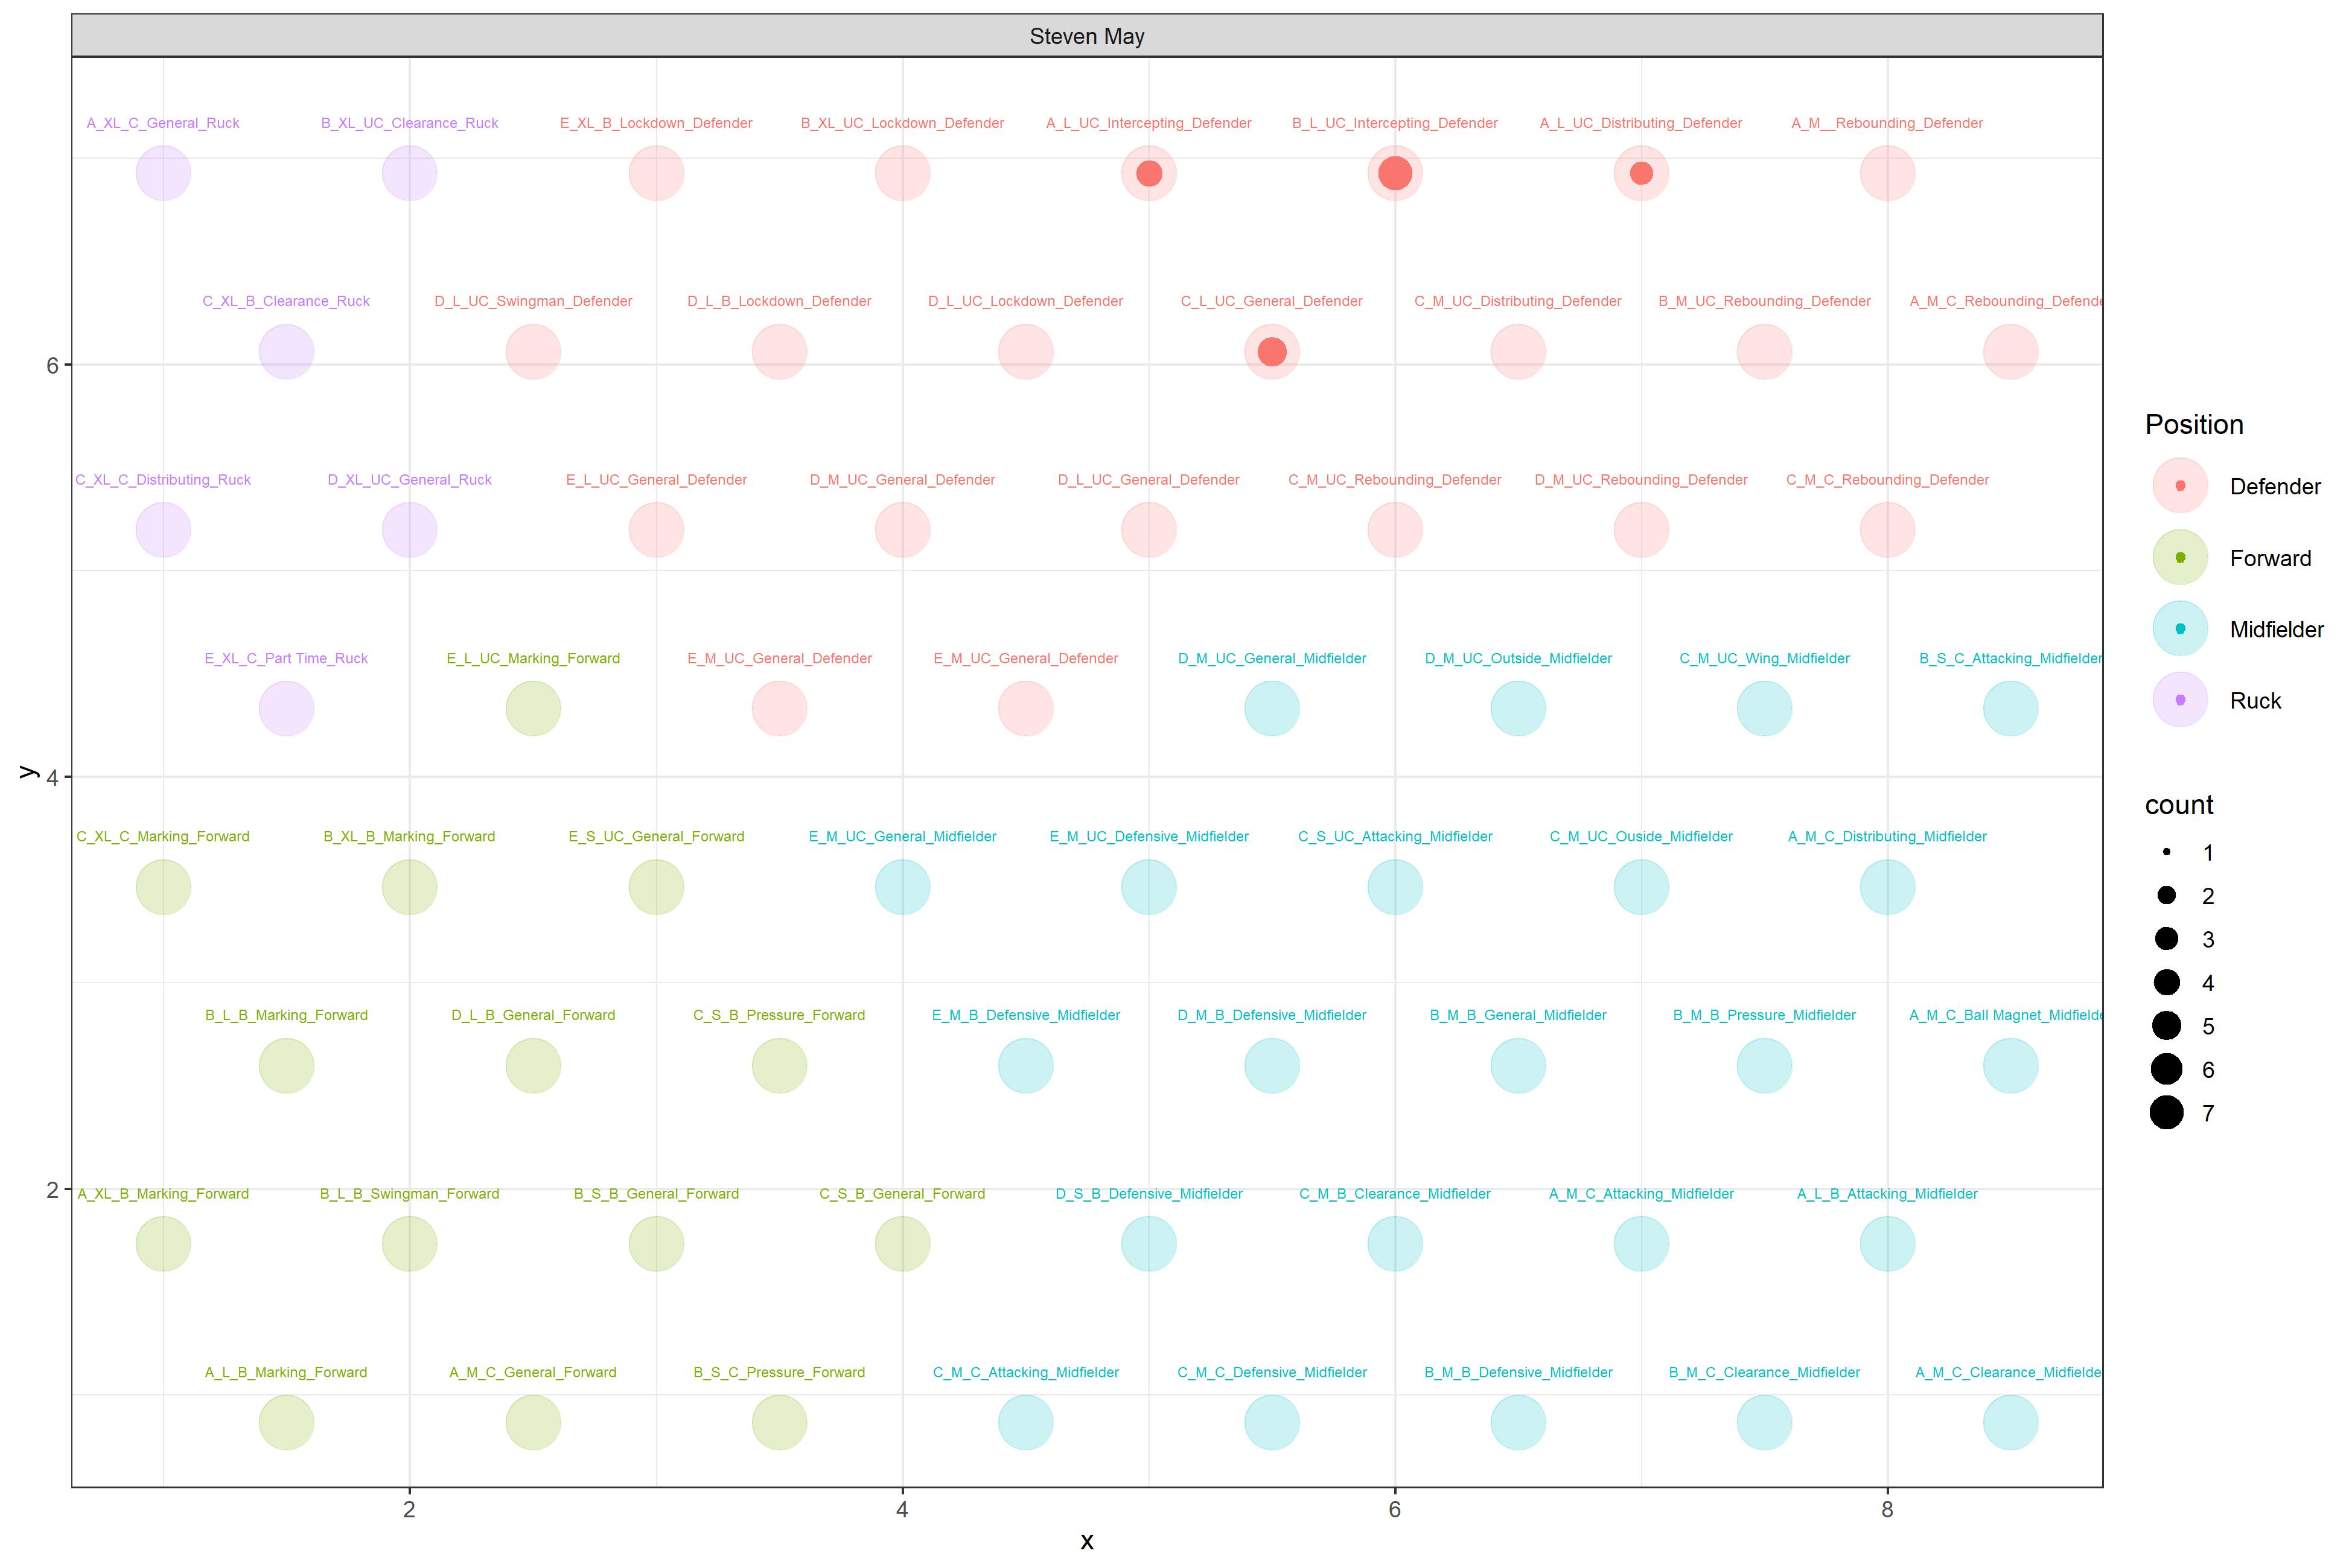
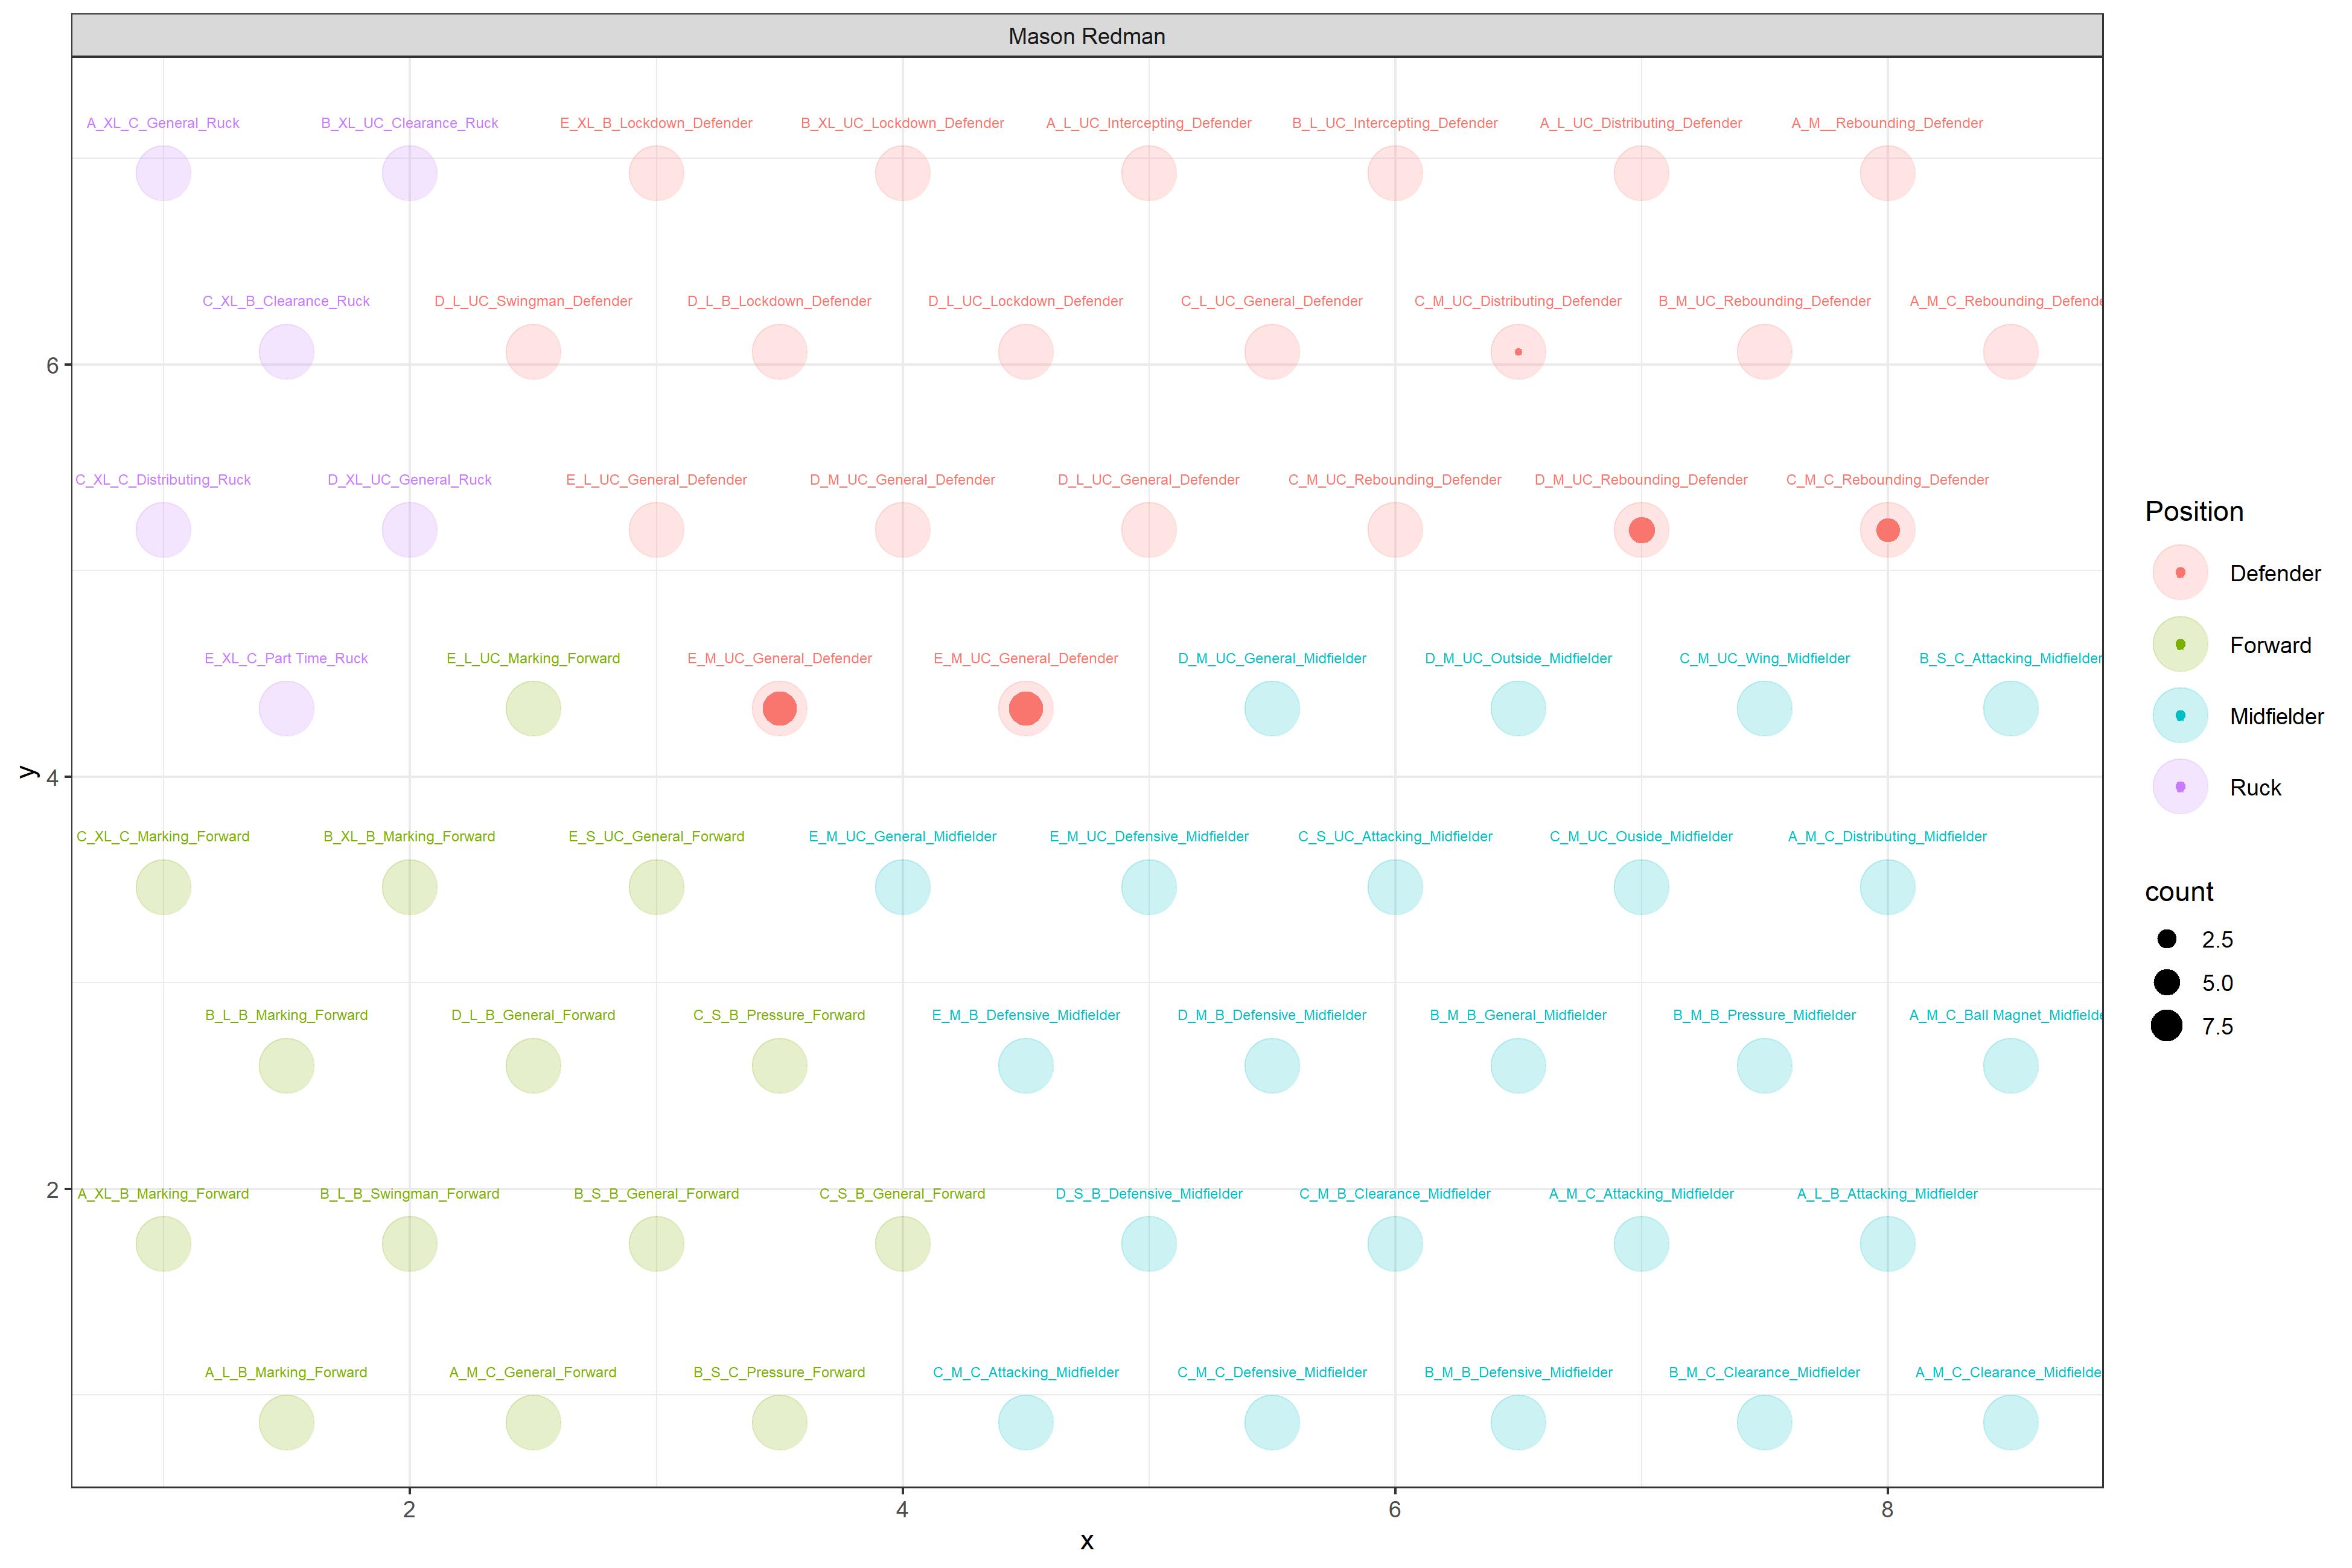
I used a self organising map and the last 8 years of stats to map all players to 64 nodes which should represent their position (Ruck ,Mid, Forward, Defender), playing style, quality (roughly) and size (S-XL). I have ideas on how to use it to address team gaps, player similarity, strengths and weakness etc. Anyway I have been reading the Jake Kelly thread and seeing all the comparisons to our current defenders (i.e. who does he boot out if any). Thought I would share visualisations (they aren’t super beautiful, sorry about that).
Players positions on the SOM map are calculated by their 5 game rolling statistical average so their first few games will include the end of 2020 (i.e. Jayden Laverde starts 2021 as a forward, then a swingman, although he has been defense all year). I have included a few well known defenders as references as well. Dylan Grimes in particular shows the potential flaws in the system, particularly the quality ranking, as he as best is ranked as B grade - when he clearly is higher.