Thanks.
A bit bizarre that is available in the app but not on the website.
Thanks.
A bit bizarre that is available in the app but not on the website.
I wrote this as a reply to @ivan in the Hind thread, but it’s really nothing to do with Hind, so I’m putting it here.
Some stats which back you up re the change of balance from the freo game onwards, because I wanted to have a look. How many points we scored/conceded against a team’s average. I’ve also removed their game(s) against us, so e.g. port averaged 84 points per game in their 21 games that didn’t include us, and scored 119 against us, so we get a -35. So basically, negative bad, positive good.
Before the freo game we were -16.6 for defense, +14.2 for offense. After the freo game we were +5.6 for defense, +4.2 for offense. So our defense improved by a “sort of normalised” +21 points, and our offense declined by a “sort of normalised” -10 points. Which is a net change from -2.4 to +9.8. Which I’d have to agree is a better balance.
There’s probably some rolling average or something that would be a more accurate picture to reflect form (e.g. we got +18.7 against the demons, but they had two even lower scores either side of us, including a loss to the pies, so they probably weren’t peaking when we faced them), but I ain’t doing that.
Here’s the table of those numbers per team, split into the chunks of the year you suggested.
| Team | Def 1-8 | Def 9-23 | Off 1-8 | Off 9-23 |
|---|---|---|---|---|
| Melbourne | 18.7 | -9 | ||
| Port Adelaide | -35 | -3 | ||
| Geelong | -14.8 | -9.6 | ||
| Brisbane Lions | -5.4 | -29 | ||
| Western Bulldogs | 7 | 30.1 | ||
| Sydney | 6.7 | -19.3 | 6.3 | 28.3 |
| Greater Western Sydney | -27.3 | 13.8 | 24.3 | -27.8 |
| West Coast | 9 | 1.6 | ||
| St Kilda | 7 | 64.3 | ||
| Fremantle | 11.2 | -15.7 | ||
| Richmond | -45.9 | 3.2 | ||
| Carlton | -45.7 | 18.2 | ||
| Hawthorn | -18.8 | 0.2 | 4.3 | -0.8 |
| Adelaide | 55 | -5.9 | ||
| Gold Coast | 36.7 | 14 | ||
| Collingwood | -14.6 | 6.4 | 28.7 | 21.7 |
| North Melbourne | -3.3 | -8.3 | 48.9 | 24.4 |
By those numbers, our worst lost was to the tigers and our best win was against the saints. Our normalest (definitely a word) game was when we won 86-73 against the hawks, whose average score was 86.8-73.2.
dense, but interesting
Which Blitz poster are you describing with that choice of words?
From a spreadsheet of mine…
Centre Clearance Success Rate
(Personal centre clearance/CBA)
Stringer = 16%
Shiel = 15%
Parish = 14%
Caldwell = 10%
Merrett = 8%
Perkins = 8%
Bryan = 8%
McGrath = 6%
Draper = 5%
Hobbs = 5%
Phillips = 4%
Anyone else listening to this pod?
Essendon are good at RED TIME games.
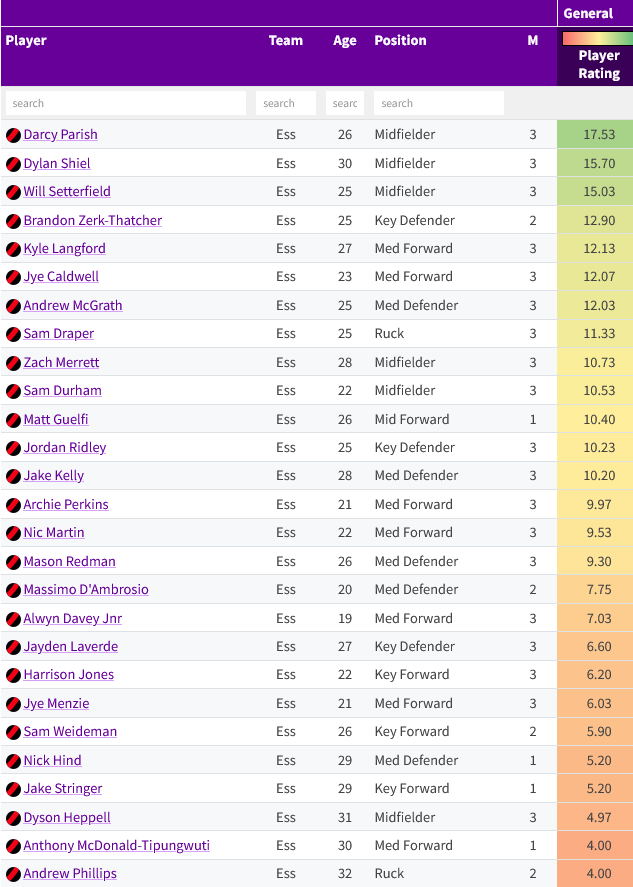
Just found a great stats website I haven’t seen around before, seems a lot better then the AFL one and even compiles stats like the player ratings and clearances per centre bounce that the AFL has access to but doesnt publish. I will be using this a lot!
Well whaddya know?
Ridley …and…Laverde & Kelly top our list for Dis/Eff.
Is that surprising?
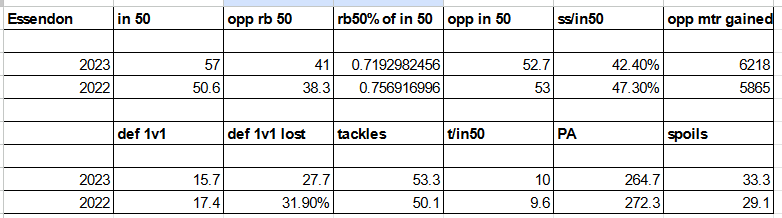
I’ve got some different numbers to the end of Rd 3 - (EDIT: No, my bad, same numbers - just averages vs aggregates):
2022: 65 def 1v1, 26 losses (40% loss rate)
2023: 47 def 1v1, 13 losses (28% loss rate)
Jake Kelly is yet to lose a def 1v1 in 2023 (5 contests), compared to having lost 54% of def 1v1 contests (7/13) to the end of Rd 3 in 2022.
That’s a pretty big improvement
Doesn’t look good for Hep. Worst of anyone who has played three games. {And Just better than Tippa who played only one quarter).
our ground ball gets are up from 81 last year to 91 this year (which is about average for both years)
last year we gave our opponents a shot on goal from 50% of their inside 50s, 3 worst in the comp. So far this season we’re running at 46% (6th best)
our opponents accuracy in front of goal last year was 51.9%. that’s also down to 46.6% this year. indicative of few shots from the goal square i suspect (2023 sample size caveat blah blah blah)
Imagine if Mason stopped giving away 50s!