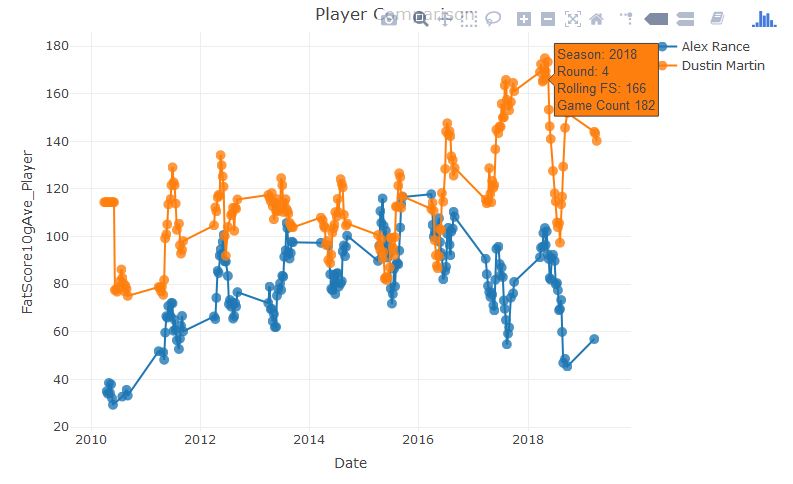
Have you (or somebody else) ever looked at measuring team performance based on player form (something like players last 3-5 games relative to the player moving 2/3 season player average)? I’ve always wondered if there is a way to predict the impact of a teams Form based on it’s individual players playing well or not. i.e. Richmond who in their premiership year had all their top tier players (Martin, Reiwolt, Cotchin, Rance) playing at their peak, same with Dogs in their run to 2016. I think for this to work it would also require it to assess who is on the park from their list. i.e. Richmond now might have all it’s best players on the field playing well each week, but they are not the best players on the list as a whole. I guess you would have to test which stats (contested possessions, disposal, kicking % etc) then had a impact on the prediction. i.e. if Rances kicking % drops to diabolical levels does that impact the prediction, so you stats weightings would be tough.
Its a 10 game rolling average, so it peaks not long after 2017 for both of them. It also isn’t a fair reflection on Rance, as much as I hate to say it.
For reference, 135 is the 95th percentile and therefore elite.
There was a company going around a couple of years ago trying to sell Clubs a Player ranking and importance valuation to use in trading and list decisions, trying to assess an individual players worth to a side. I always thought if you could do that then you could build a Best22 from the importance based on some basic team structure parameters and measure form and performance individually and the list from there. Essentially you could also predict if a team played above their prediction or below. i.e. ESS in 2017 may have overperformed, hence our disappointment now. But that tying in form of players as they progress over time could make it more predictive in the season.
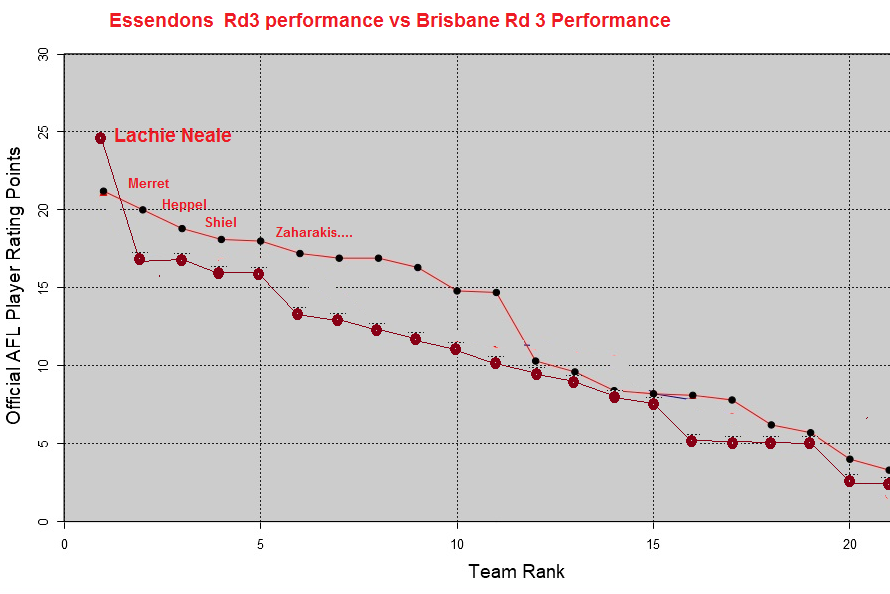
This graph tells me to bring in Myers or someone who should never player again and pop Neale’s head off at the starting bounce.
Make a statement Essendon.
One of the problems I have with generalised statistics like this is the low resolution, or lack of detail which can greatly affect outcomes. How can I explain - for example, you can get lots of stats for a tall defender that may have relevance - but none of them will ever tell you figures based on who they played against, what their opponent played like, if they had the 1st or 2nd forward, if they had a specific role - rebounding or locking down, where they were instructed to kick out, if the ball was wet, and so on and so forth.
These are things the absolutely incredible machine in our heads can do amazingly well. Statistics to me can help find the reason for things, but we are not at the stage where the resolution can be relied on.
I know I made up the whole ‘resolution’ thing, sue me.
This is like saying we can’t use Newton’s laws because we haven’t figured a grand unifying theory or saying we can’t predict the weather because we don’t have enough resolution in our data to predict every rain drop. No offense deckham, you might be the greatest mind to ever watch football but it seems you’re missing the point massively of this thread and stats in general. everyone has biases and most people are blind to them. Statistics are just science, science is setting a hypothesis and testing it and finding it valid or invalid. We are generalising yes, but at least it’s reproducable and we can back up our statements.
Any insight into why you chose a SOM vs a Cluster analysis? I know the unsupervised nature is kind of what makes in interesting, but it’s also a bit opaque.
I don’t know, just trying to understand and I can’t quite remember when you’d use each?
I guess how easy is it to build a NN that classifies players based on historical stats, and then you can feed in the seasons numbers?
Well, we did both really - the SOM splits the data into its nodes and then we do a kmeans clustering on the nodes to get the positions. The SOM is really just a way of reducing the data into two dimensions for visualisation as well - I like the regular lattice and how you can plot changes over time on it. I can also save the model and apply new data to it and get the same labels.
We could do this in a supervised way, if you can find a good database of positions (particularly the high resolution ones like “Rebounding defender” or “Attacking Midfielder”), but I couldn’t find anything suitable.
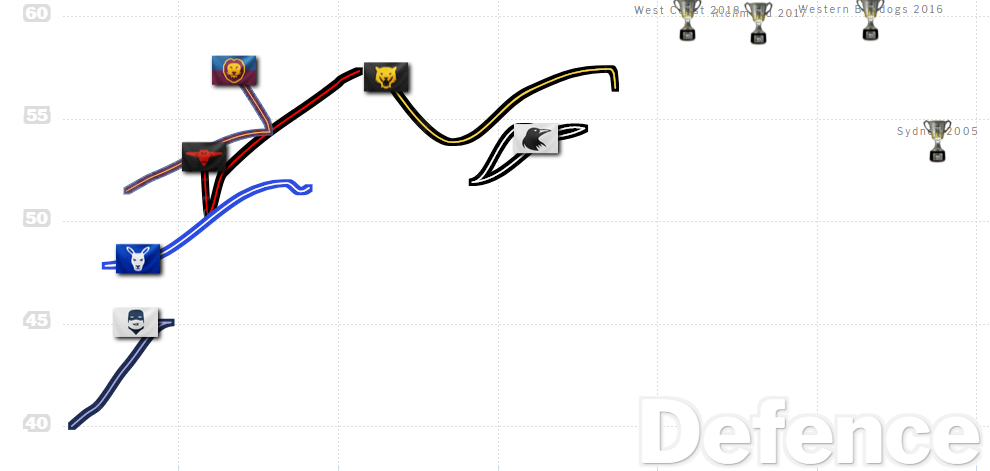
Looking at future opponents performances so far, ( up to the end of round 3 ) on the Squiggle defence vs attack trajectory plot
Look at the massive defensive setback for Richmond after the loss of Rance
We are poor defensively compared with Collingwood and about the same attacking . Not looking good for Anzac Day.
Kangaroos look poor so far, nearly as bad as FCFC. I think we can pencil this in.
Squiggle show us at 57% more likely to win against Brisbane. We need to improve our defensive performance and make sure the forwards get going like last week.